Fig. 13
Download original image
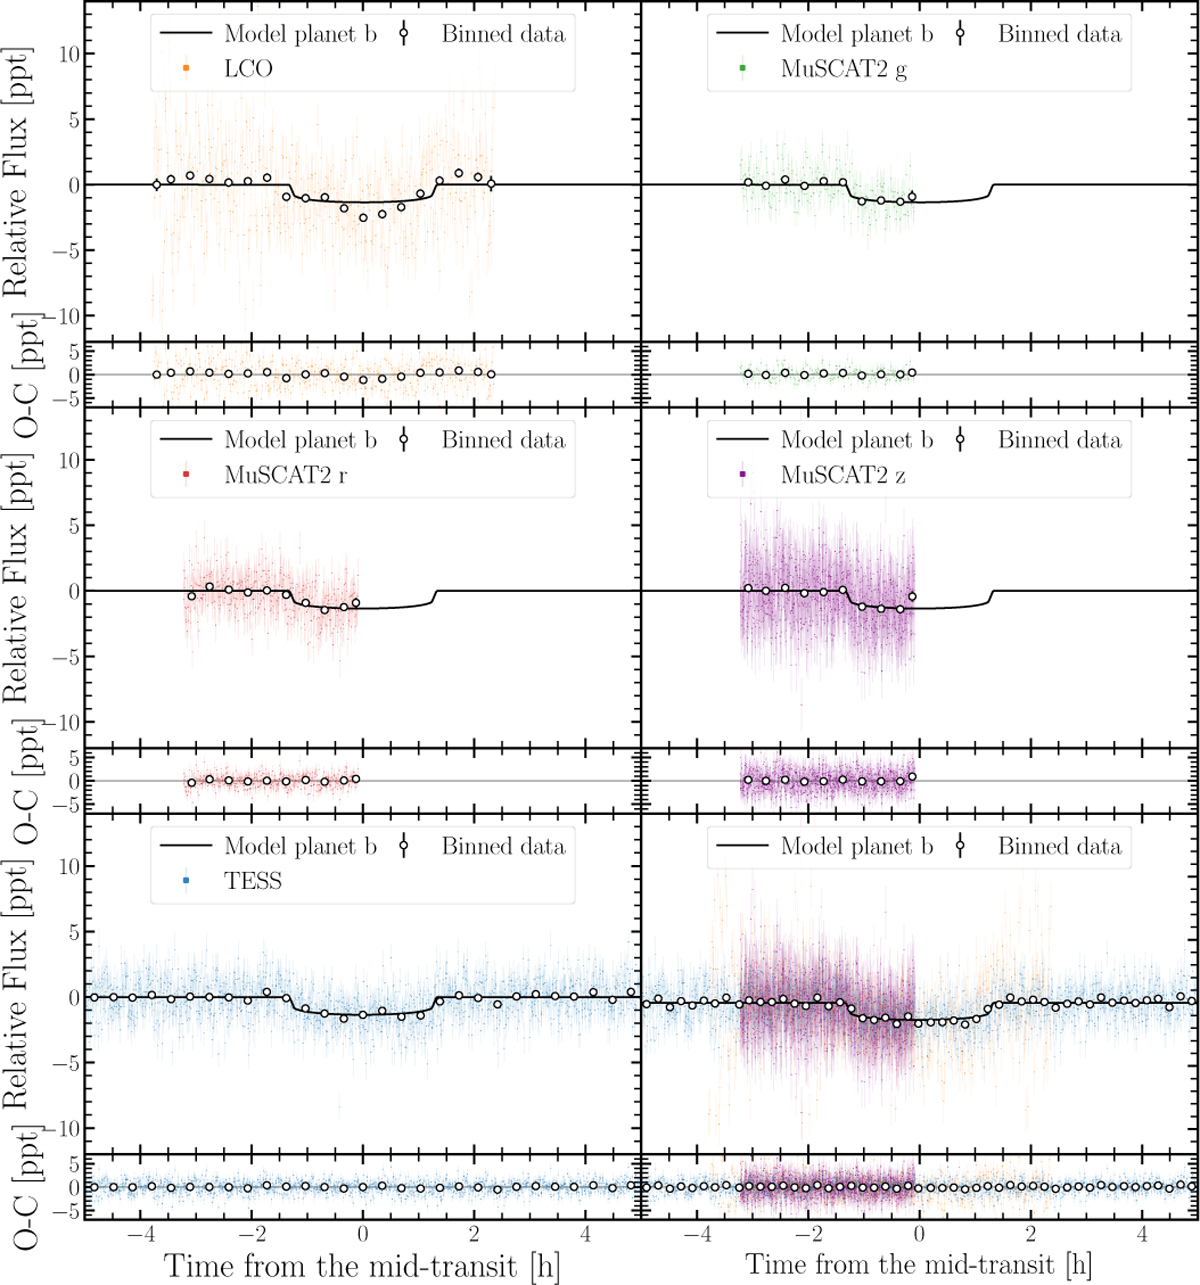
Phase-folded light curves of TOI-1801 b for data of LCO zs, MuSCAT2 g′, MuSCAT2 r′, MuSCAT2 zs, TESS, and the combination of all them. In each sub-panel, the photometric data (coloured dots) are shown, along with the binned data (white dots), the best transit-fit model (black line) in the top, and the residuals for the best fit in the bottom.
Current usage metrics show cumulative count of Article Views (full-text article views including HTML views, PDF and ePub downloads, according to the available data) and Abstracts Views on Vision4Press platform.
Data correspond to usage on the plateform after 2015. The current usage metrics is available 48-96 hours after online publication and is updated daily on week days.
Initial download of the metrics may take a while.