Fig. 11
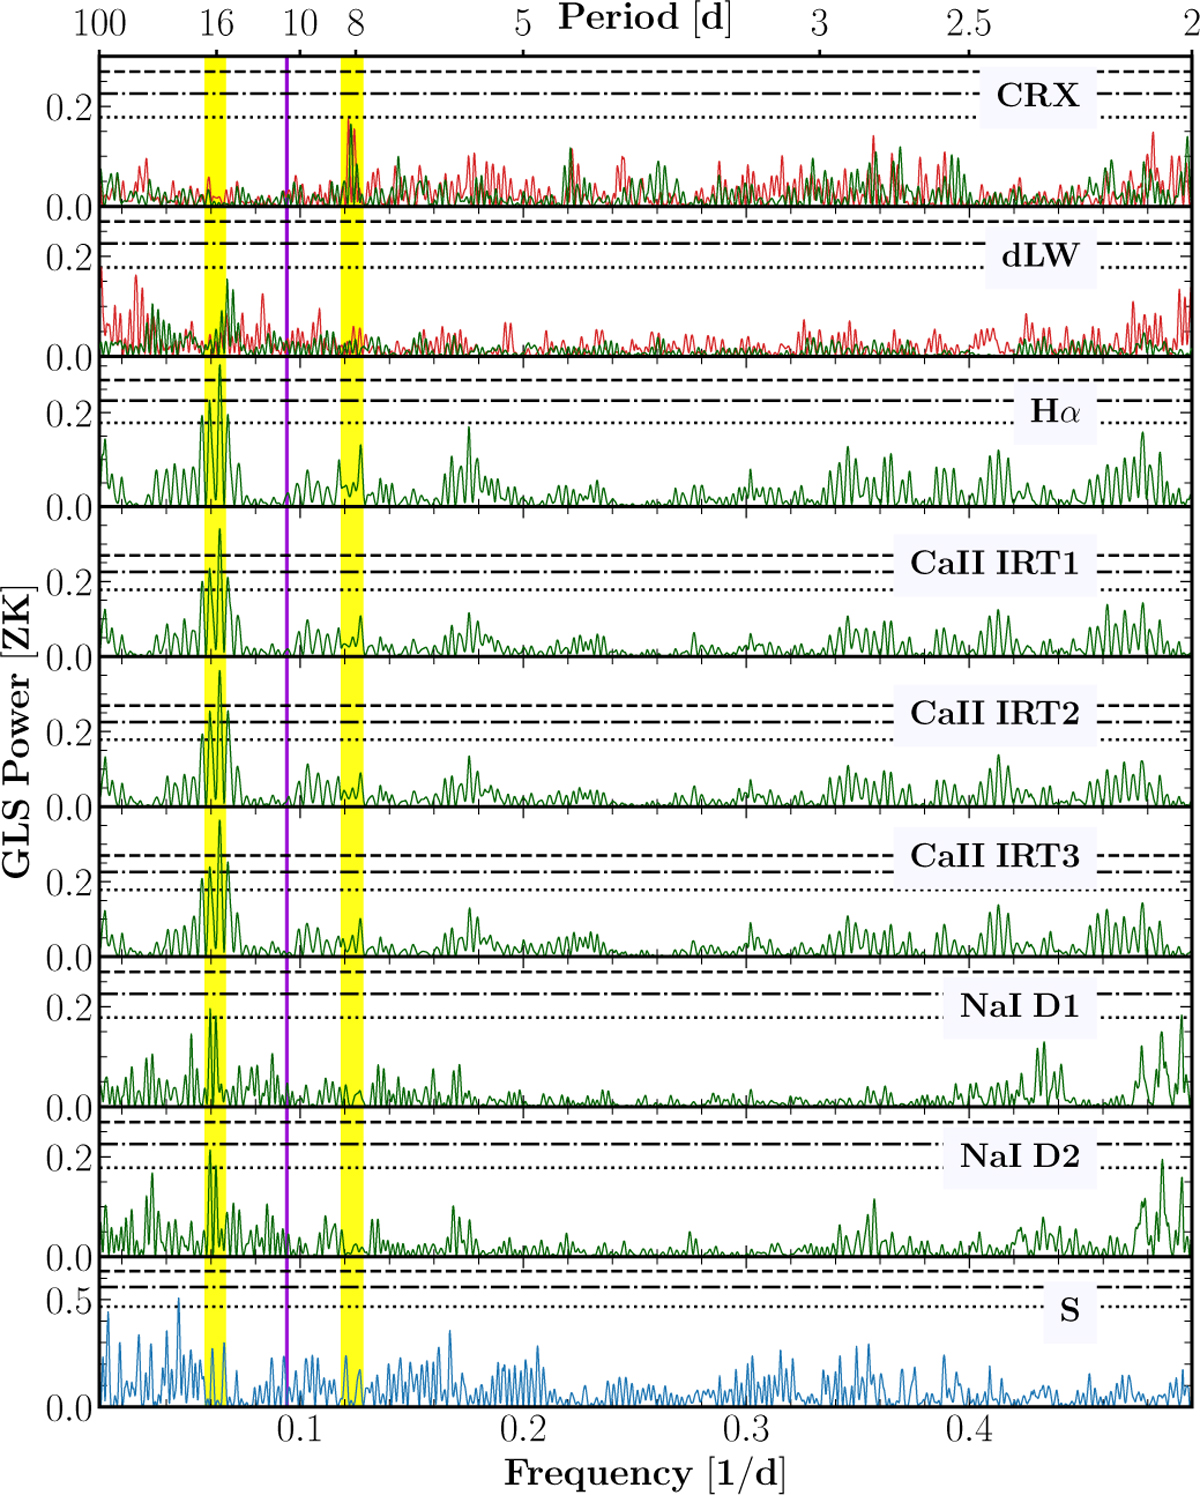
Download original image
GLS periodograms of the spectral activity indicators from CARMENES VIS (green) and NIR data (red), and the S index from HIRES data (blue). In all panels, the solid vertical purple line indicates the orbital period (10.64 d) of the planet, and the vertical yellow shaded bands indicate the rotation period derived from the combined photometry data sets and half the rotation period. The dashed horizontal black lines correspond to FAP levels of 10, 1, and 0.1% (from bottom to top).
Current usage metrics show cumulative count of Article Views (full-text article views including HTML views, PDF and ePub downloads, according to the available data) and Abstracts Views on Vision4Press platform.
Data correspond to usage on the plateform after 2015. The current usage metrics is available 48-96 hours after online publication and is updated daily on week days.
Initial download of the metrics may take a while.