Open Access
Fig. 1
Download original image
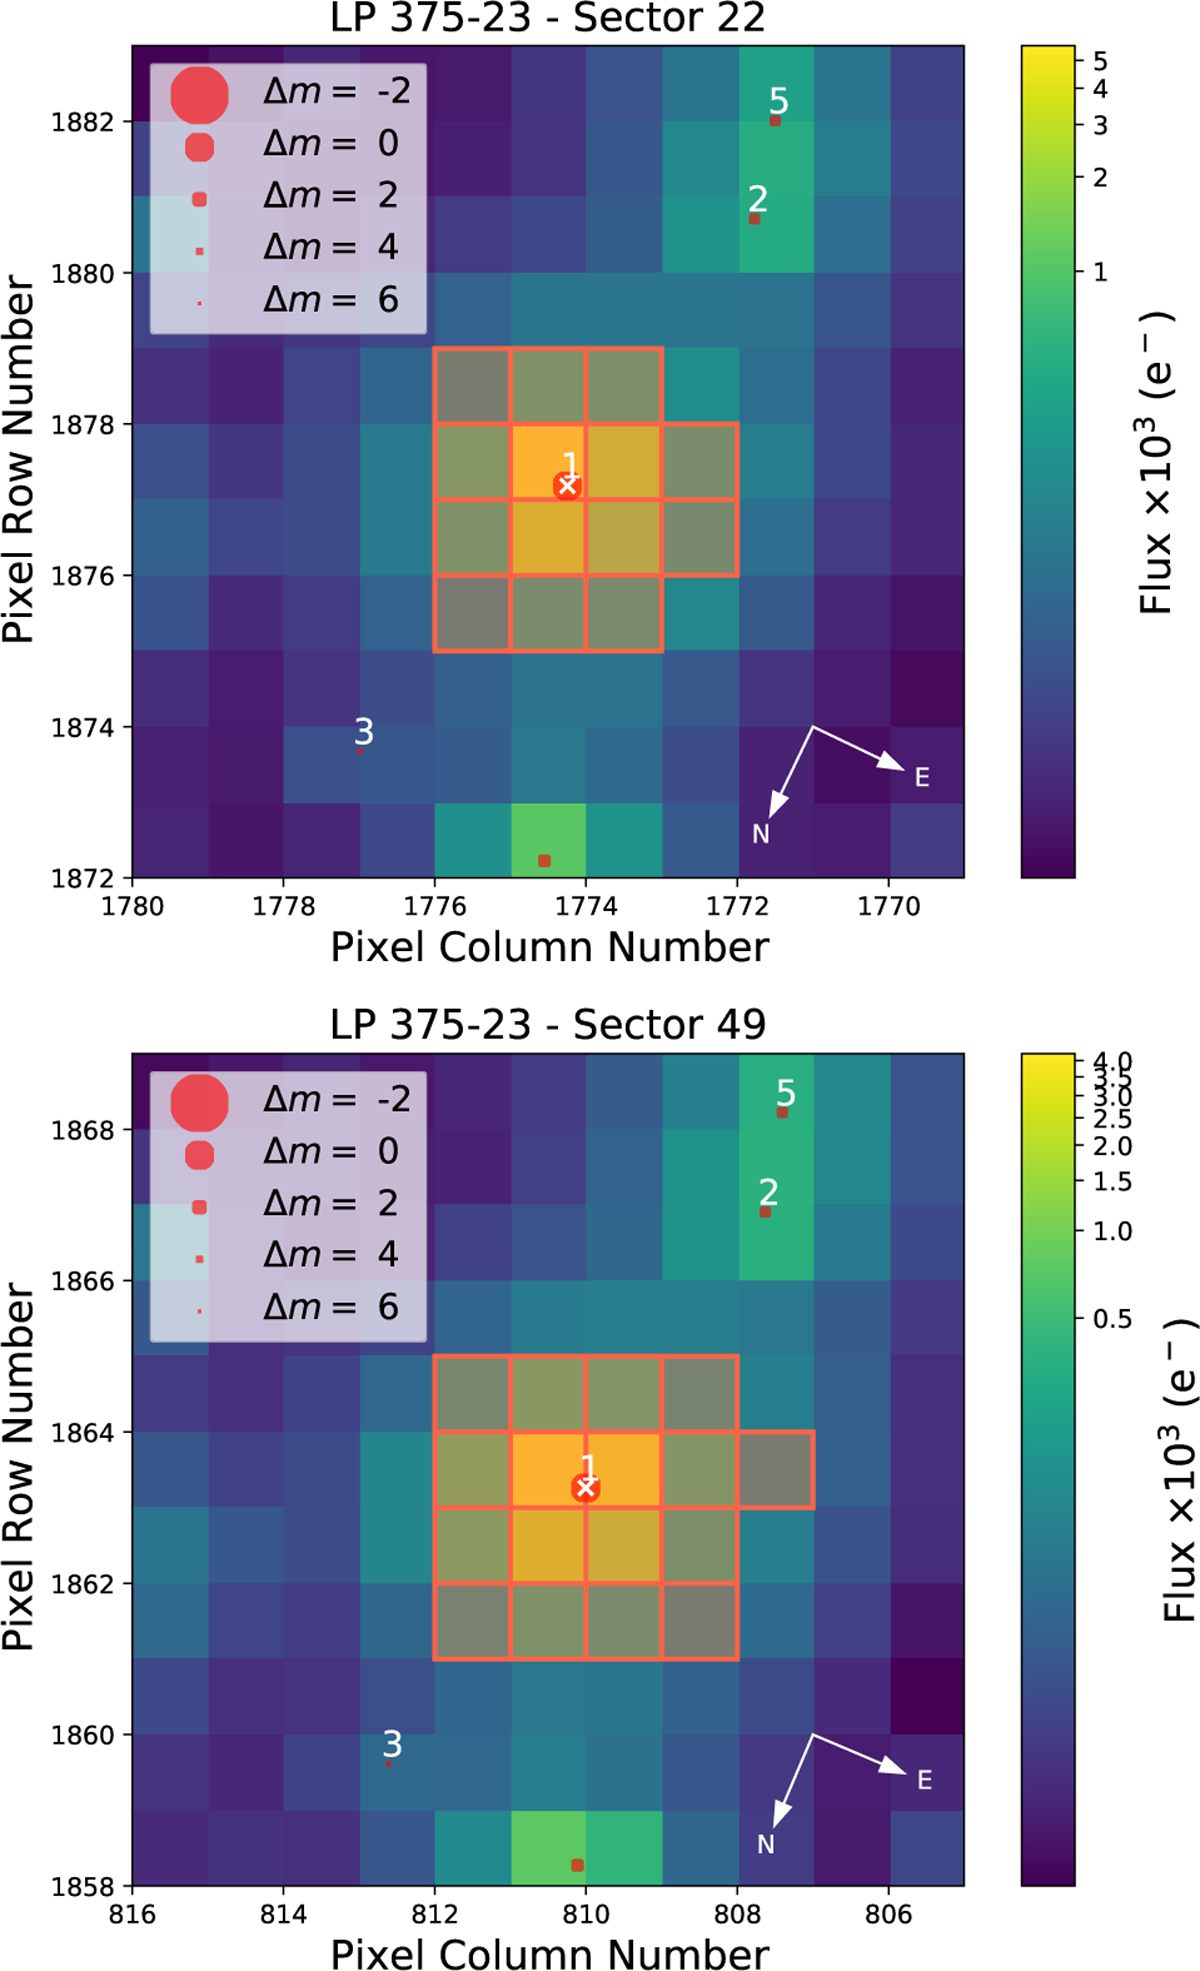
TPF plot for TOI-1801 in sector 22 (top) and sector 49 (bottom). The red squares indicate the best-fit photometric aperture that was used to obtain the SAP flux. G-band magnitudes from Gaia DR3 are shown with different sizes of red circles for all nearby stars up to 6 mag fainter.
Current usage metrics show cumulative count of Article Views (full-text article views including HTML views, PDF and ePub downloads, according to the available data) and Abstracts Views on Vision4Press platform.
Data correspond to usage on the plateform after 2015. The current usage metrics is available 48-96 hours after online publication and is updated daily on week days.
Initial download of the metrics may take a while.