Fig. 9.
Download original image
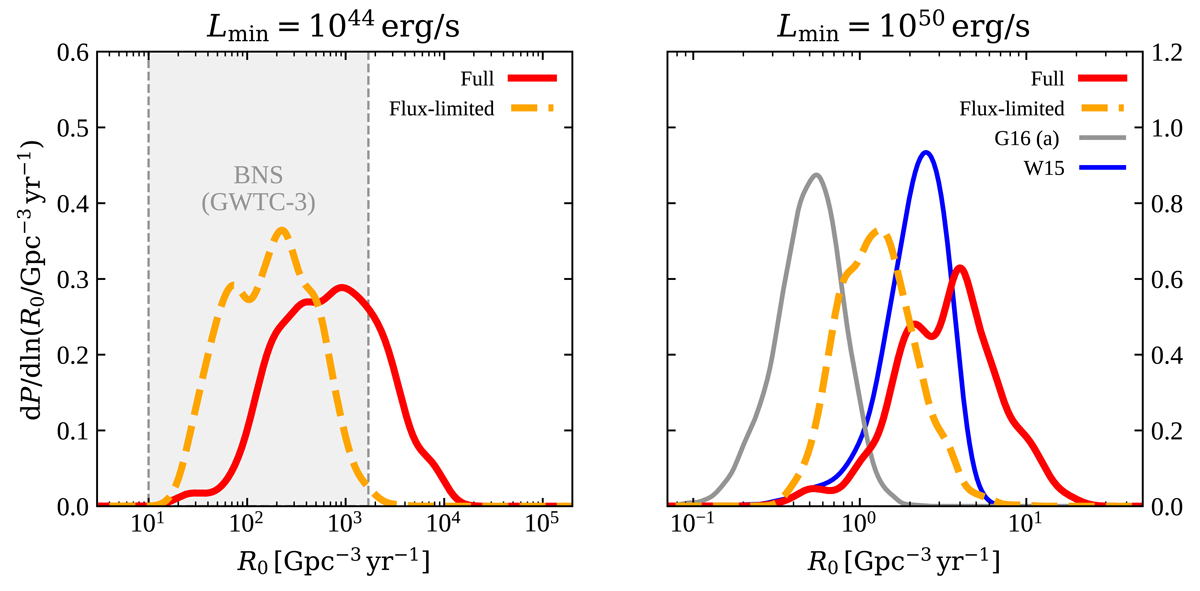
Local rate density. In the left-hand panel, the solid red (respectively dashed orange) line shows the posterior probability density on the total local rate density, R0, of SGRBs with a luminosity L > 1044 erg s−1 (which encompasses all viewing angles) from our analysis using the full (respectively flux-limited) sample. The grey shaded band shows the constraint on the local rate density of BNS mergers from GW observations, as derived in Abbott et al. (2023). In the right-hand panel, the solid red and dashed orange lines show the local rate density for events with a luminosity L > 1050 erg s−1 in our two analysis setups. For comparison, we show the corresponding local rate densities from W15 and G16 above the same minimum luminosity.
Current usage metrics show cumulative count of Article Views (full-text article views including HTML views, PDF and ePub downloads, according to the available data) and Abstracts Views on Vision4Press platform.
Data correspond to usage on the plateform after 2015. The current usage metrics is available 48-96 hours after online publication and is updated daily on week days.
Initial download of the metrics may take a while.