Fig. 8.
Download original image
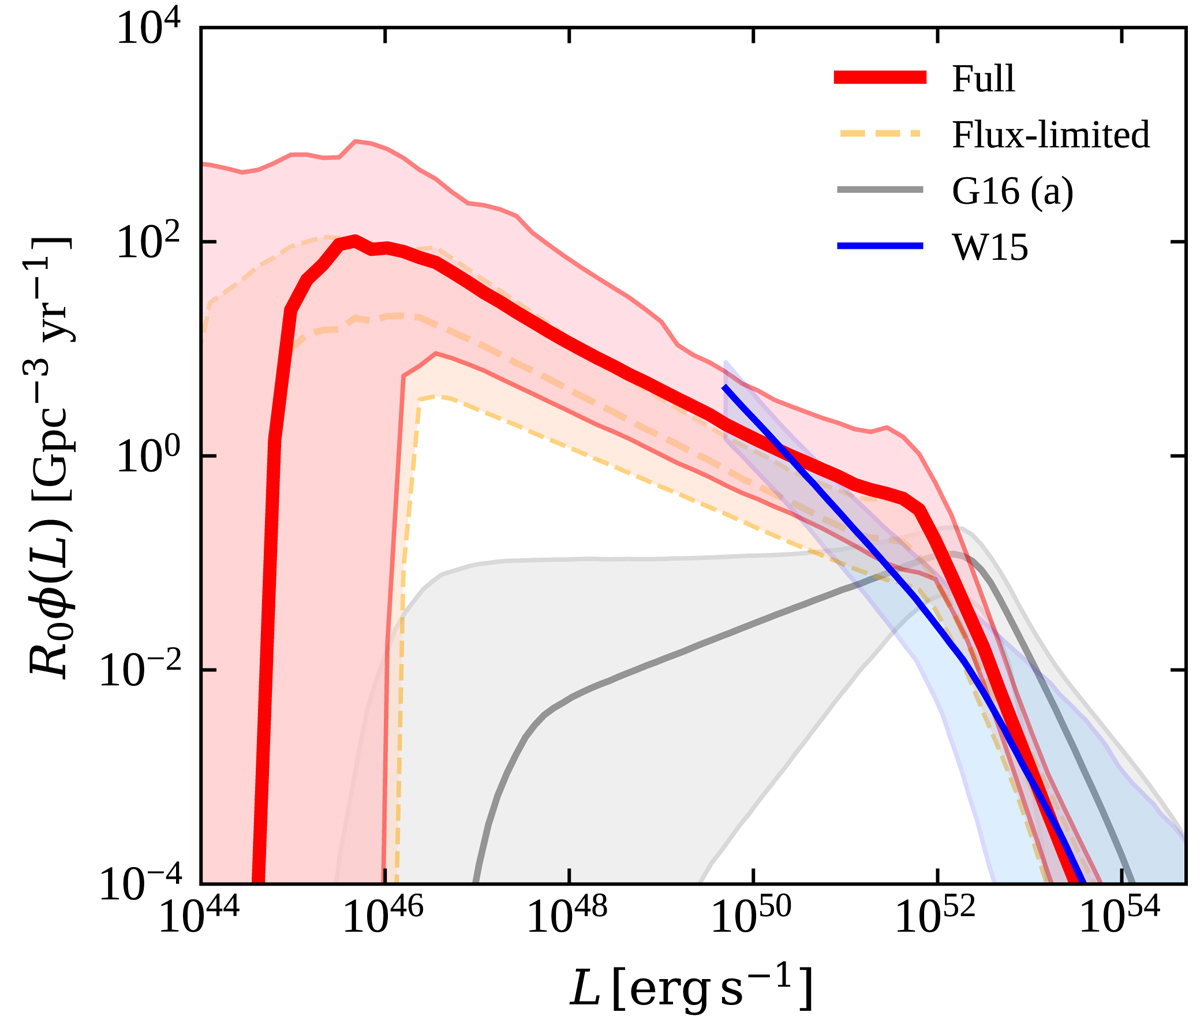
Luminosity function. The median of the posterior probability density of R0ϕ(L) = dR0/dln(L) (i.e. the local rate density per unit logarithm of the peak luminosity) from the full sample analysis is shown with a solid red line, while the dashed orange line refers to the flux-limited sample analysis. The shaded regions encompass the symmetric 90% credible interval at each fixed L. We show for comparison the corresponding results from W15 (blue) and G16 (grey – their fiducial model ‘a’). The credible region of W15 is computed assuming uncorrelated errors on their parameters.
Current usage metrics show cumulative count of Article Views (full-text article views including HTML views, PDF and ePub downloads, according to the available data) and Abstracts Views on Vision4Press platform.
Data correspond to usage on the plateform after 2015. The current usage metrics is available 48-96 hours after online publication and is updated daily on week days.
Initial download of the metrics may take a while.