Fig. 7.
Download original image
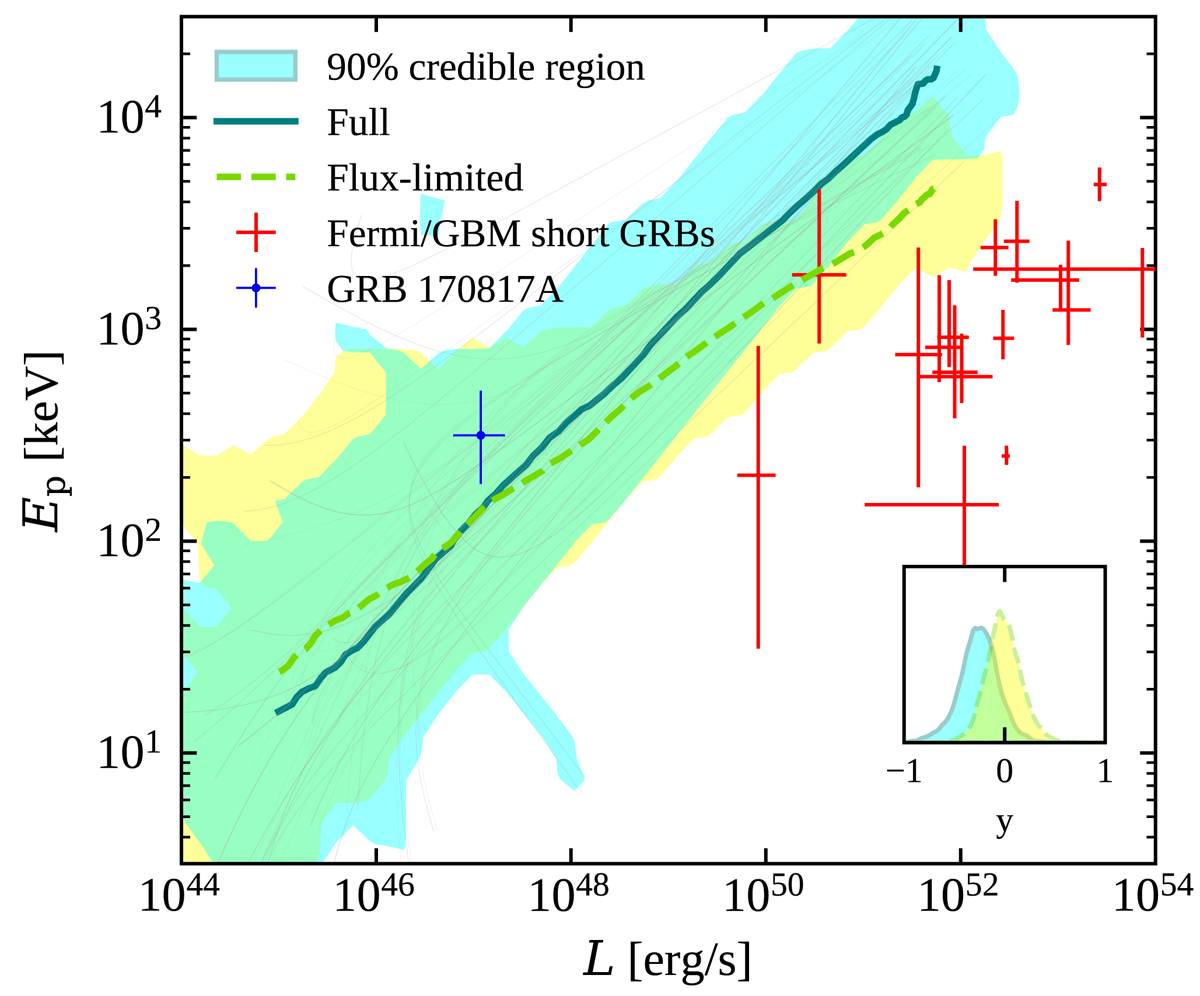
Average apparent jet structure in the L − Ep plane. The solid turquoise line connects the points ![]() at varying viewing angles, where ⟨ ⋅ ⟩ represents the median, from the full sample analysis. The turquoise shaded area encompasses the corresponding 90% credible range. Grey lines show 100 posterior samples of the lines
at varying viewing angles, where ⟨ ⋅ ⟩ represents the median, from the full sample analysis. The turquoise shaded area encompasses the corresponding 90% credible range. Grey lines show 100 posterior samples of the lines ![]() from the same analysis. The dashed green line and yellow area show the corresponding results for the flux-limited sample analysis. The crosses mark the positions of the Fermi/GBM SGRBs with known redshifts (all in red except for GRB 170817A, which is shown in blue). The inset shows the posterior probability density on the y parameter that sets the slope of the correlation between the on-axis luminosity and the on-axis SED peak photon energy, with the results of the two analyses colour coded as in the main panel.
from the same analysis. The dashed green line and yellow area show the corresponding results for the flux-limited sample analysis. The crosses mark the positions of the Fermi/GBM SGRBs with known redshifts (all in red except for GRB 170817A, which is shown in blue). The inset shows the posterior probability density on the y parameter that sets the slope of the correlation between the on-axis luminosity and the on-axis SED peak photon energy, with the results of the two analyses colour coded as in the main panel.
Current usage metrics show cumulative count of Article Views (full-text article views including HTML views, PDF and ePub downloads, according to the available data) and Abstracts Views on Vision4Press platform.
Data correspond to usage on the plateform after 2015. The current usage metrics is available 48-96 hours after online publication and is updated daily on week days.
Initial download of the metrics may take a while.