Fig. 6.
Download original image
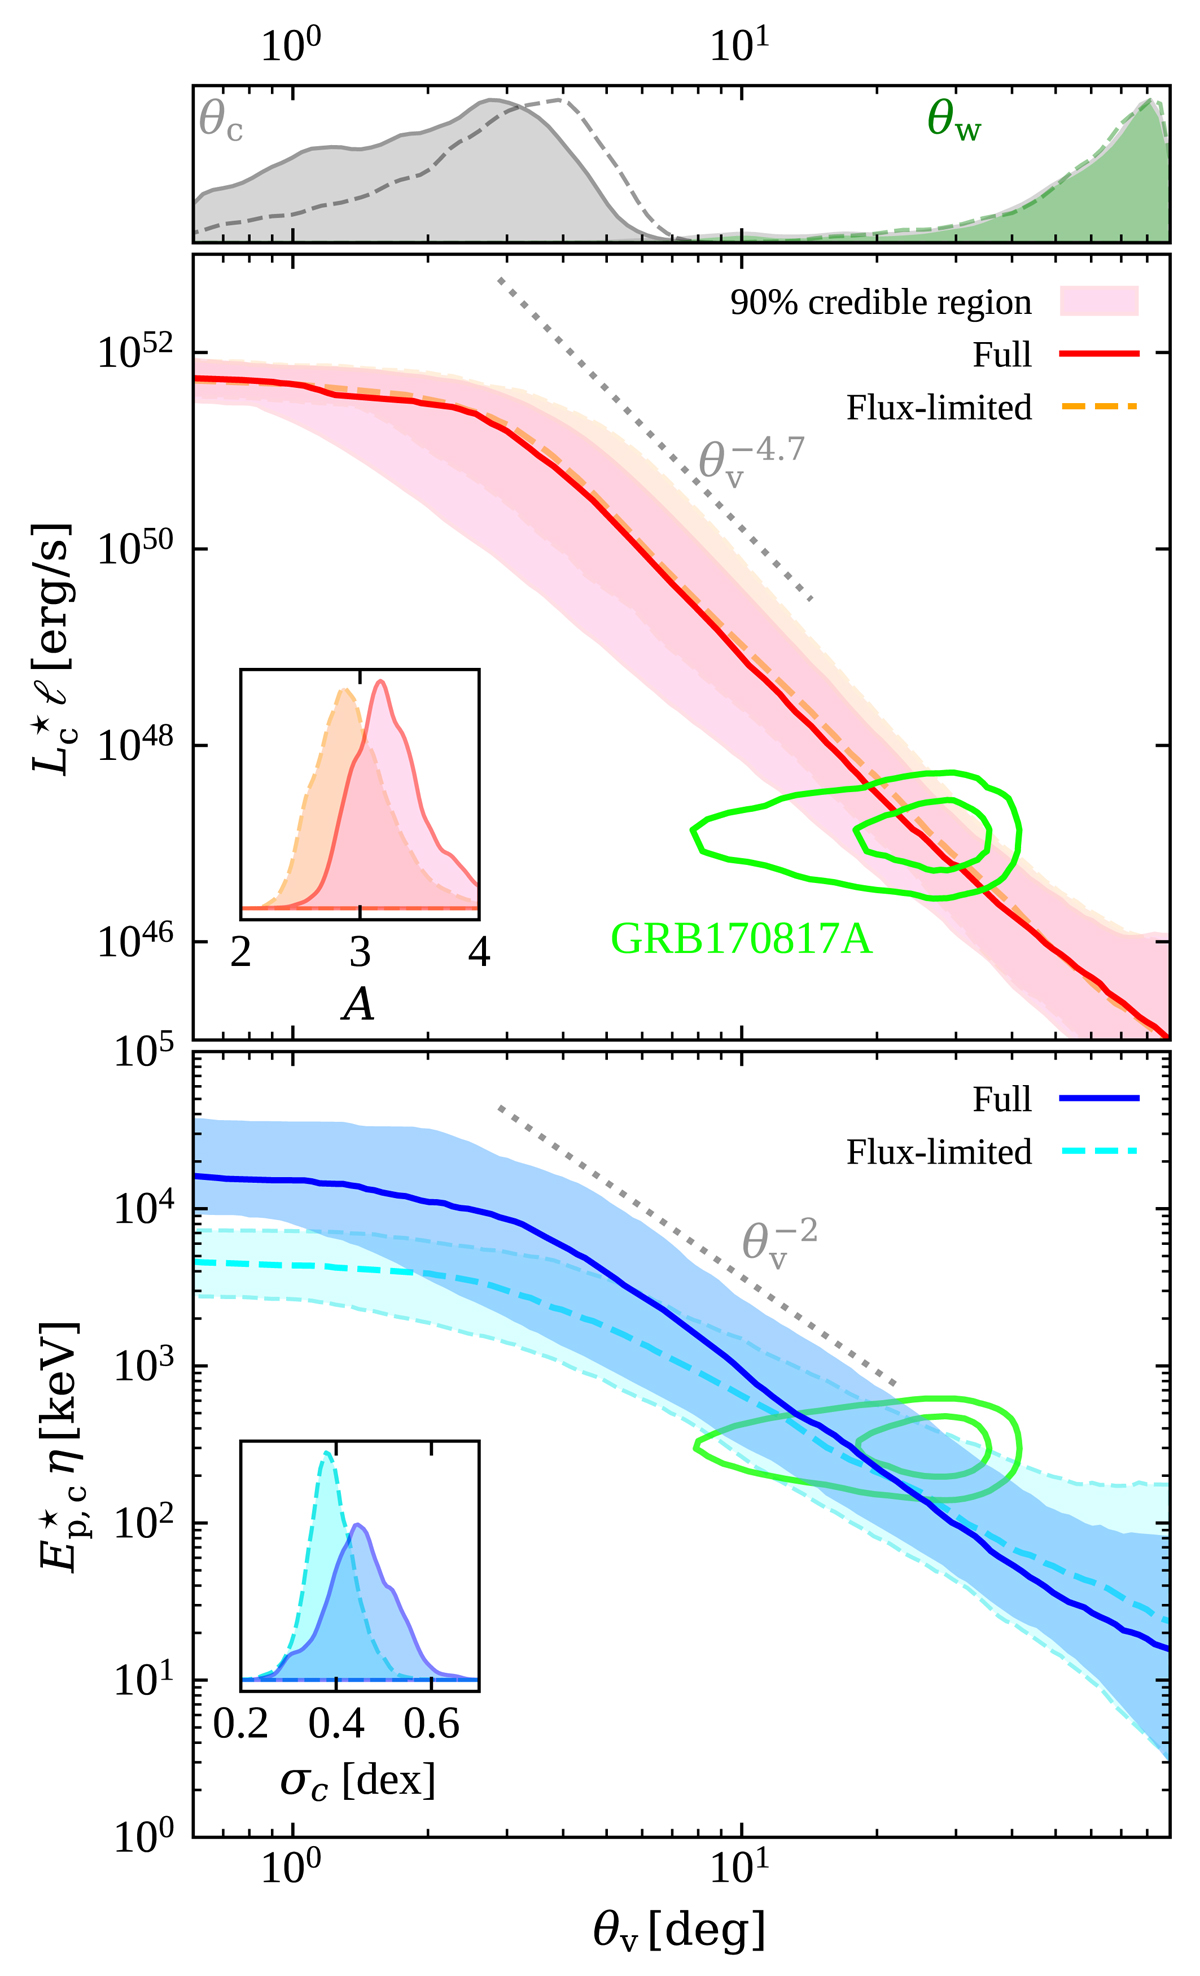
Average apparent jet structure. The two larger panels show the constraints on the SGRB average apparent structure obtained from our analysis: solid lines show the medians of the projected posterior distributions of the jet structure functions at fixed θv from the full sample analysis (red: ![]() ; blue:
; blue: ![]() ), while dashed lines refer to the flux-limited sample (orange:
), while dashed lines refer to the flux-limited sample (orange: ![]() ; cyan:
; cyan: ![]() ). The shaded region around each line encompasses the corresponding 90% credible range at each fixed θv. Dotted lines show reference power law trends. The light green contours show the 50% and 90% credible regions of (L, θv) (middle panel) and (Ep, θv) (bottom panel) for GRB 170817A (Sect. 2.4.3). The insets show the posterior distributions on the parameters A and σc that determine the dispersion around the average structure within the population. The top smaller panel shows the posterior distributions on the logarithms of the transition angles, ln(θc) (grey) and ln(θw) (green), with the results for the full sample shown as filled areas, and those for the flux-limited sample shown as dashed lines.
). The shaded region around each line encompasses the corresponding 90% credible range at each fixed θv. Dotted lines show reference power law trends. The light green contours show the 50% and 90% credible regions of (L, θv) (middle panel) and (Ep, θv) (bottom panel) for GRB 170817A (Sect. 2.4.3). The insets show the posterior distributions on the parameters A and σc that determine the dispersion around the average structure within the population. The top smaller panel shows the posterior distributions on the logarithms of the transition angles, ln(θc) (grey) and ln(θw) (green), with the results for the full sample shown as filled areas, and those for the flux-limited sample shown as dashed lines.
Current usage metrics show cumulative count of Article Views (full-text article views including HTML views, PDF and ePub downloads, according to the available data) and Abstracts Views on Vision4Press platform.
Data correspond to usage on the plateform after 2015. The current usage metrics is available 48-96 hours after online publication and is updated daily on week days.
Initial download of the metrics may take a while.