Fig. 4.
Download original image
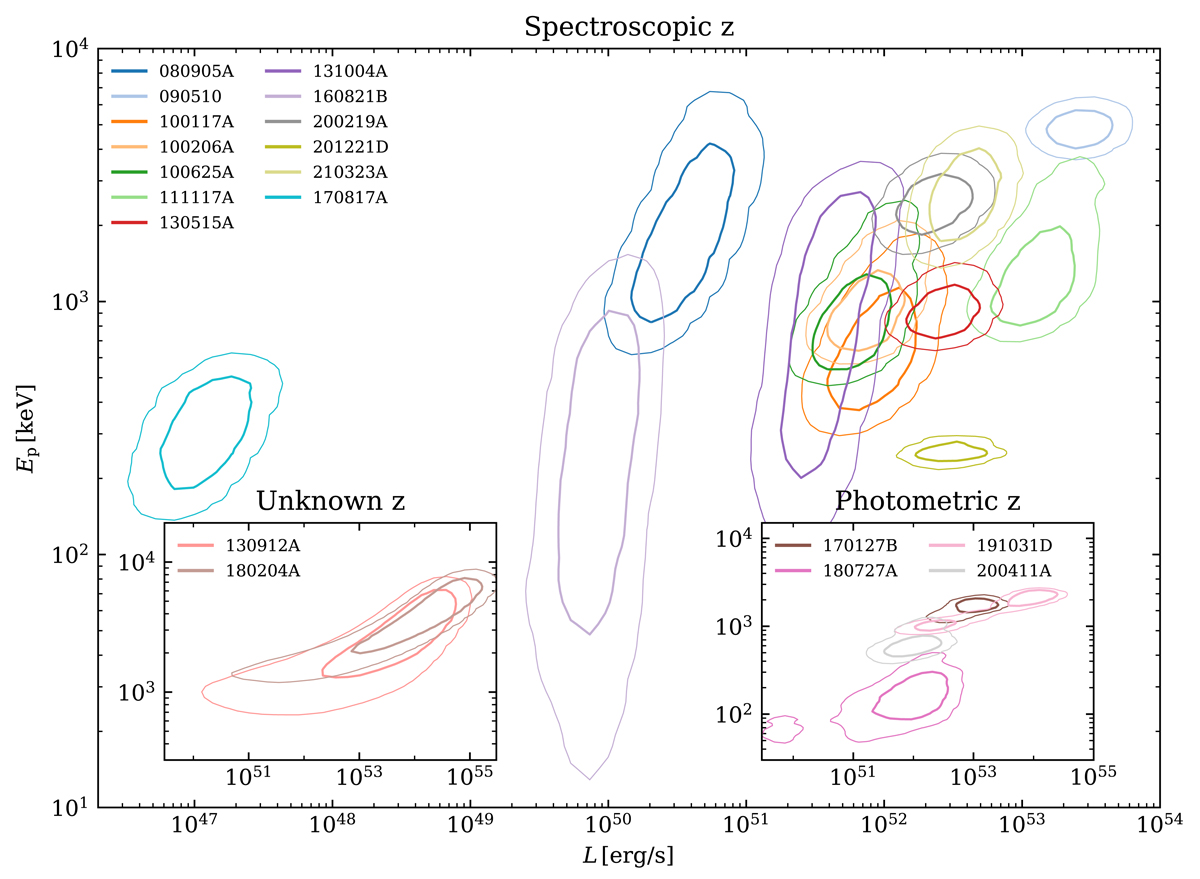
L − Ep contours for our sub-sample of Fermi/GBM SGRBs detected also by Swift/BAT with a 64 ms peak flux p[15 − 150] > 3.5 cm−2 s−1 (see the main text for the full sample selection criteria). The main panel shows the contours that contain 50% (thick lines) and 90% (thin lines) of the posterior probability on (L, Ep) for bursts with a spectroscopically measured redshift, plus GRB 170817A (which does not belong to the GBM+BAT sample); the right-hand inset shows the corresponding contours for four events with a photometric redshift measurement (from Fong et al. 2022); the left-hand inset shows the contours for the remaining two SGRBs with an unknown redshift, constructed assuming a uniform prior on z in the range (10−4, 4). These two events were not included in the analysis.
Current usage metrics show cumulative count of Article Views (full-text article views including HTML views, PDF and ePub downloads, according to the available data) and Abstracts Views on Vision4Press platform.
Data correspond to usage on the plateform after 2015. The current usage metrics is available 48-96 hours after online publication and is updated daily on week days.
Initial download of the metrics may take a while.