Fig. 3.
Download original image
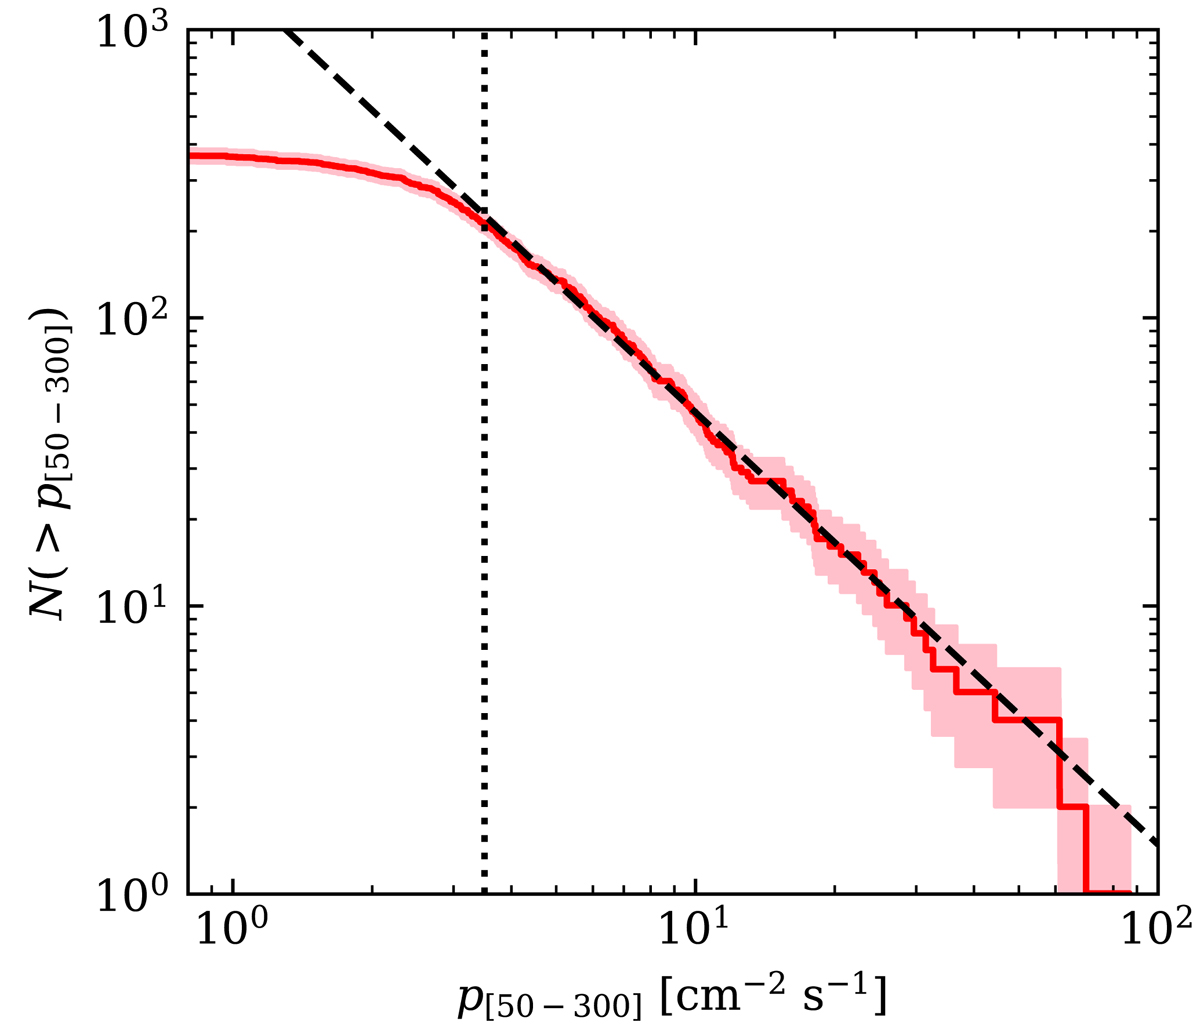
Inverse cumulative distribution of Fermi/GBM SGRB peak photon fluxes. The solid red line shows the inverse cumulative number of SGRBs detected by GBM with spectral information available in the catalogue, as a function of the peak photon flux measured on a 64 ms timescale in the 50–300 keV band. The pink band shows the one-sigma-equivalent Poisson error. The dashed black line shows a power law ![]() for reference. The vertical dotted line shows the chosen value of the flux cut for the flux-limited sample, plim, GBM = 3.5 cm−2 s−1.
for reference. The vertical dotted line shows the chosen value of the flux cut for the flux-limited sample, plim, GBM = 3.5 cm−2 s−1.
Current usage metrics show cumulative count of Article Views (full-text article views including HTML views, PDF and ePub downloads, according to the available data) and Abstracts Views on Vision4Press platform.
Data correspond to usage on the plateform after 2015. The current usage metrics is available 48-96 hours after online publication and is updated daily on week days.
Initial download of the metrics may take a while.