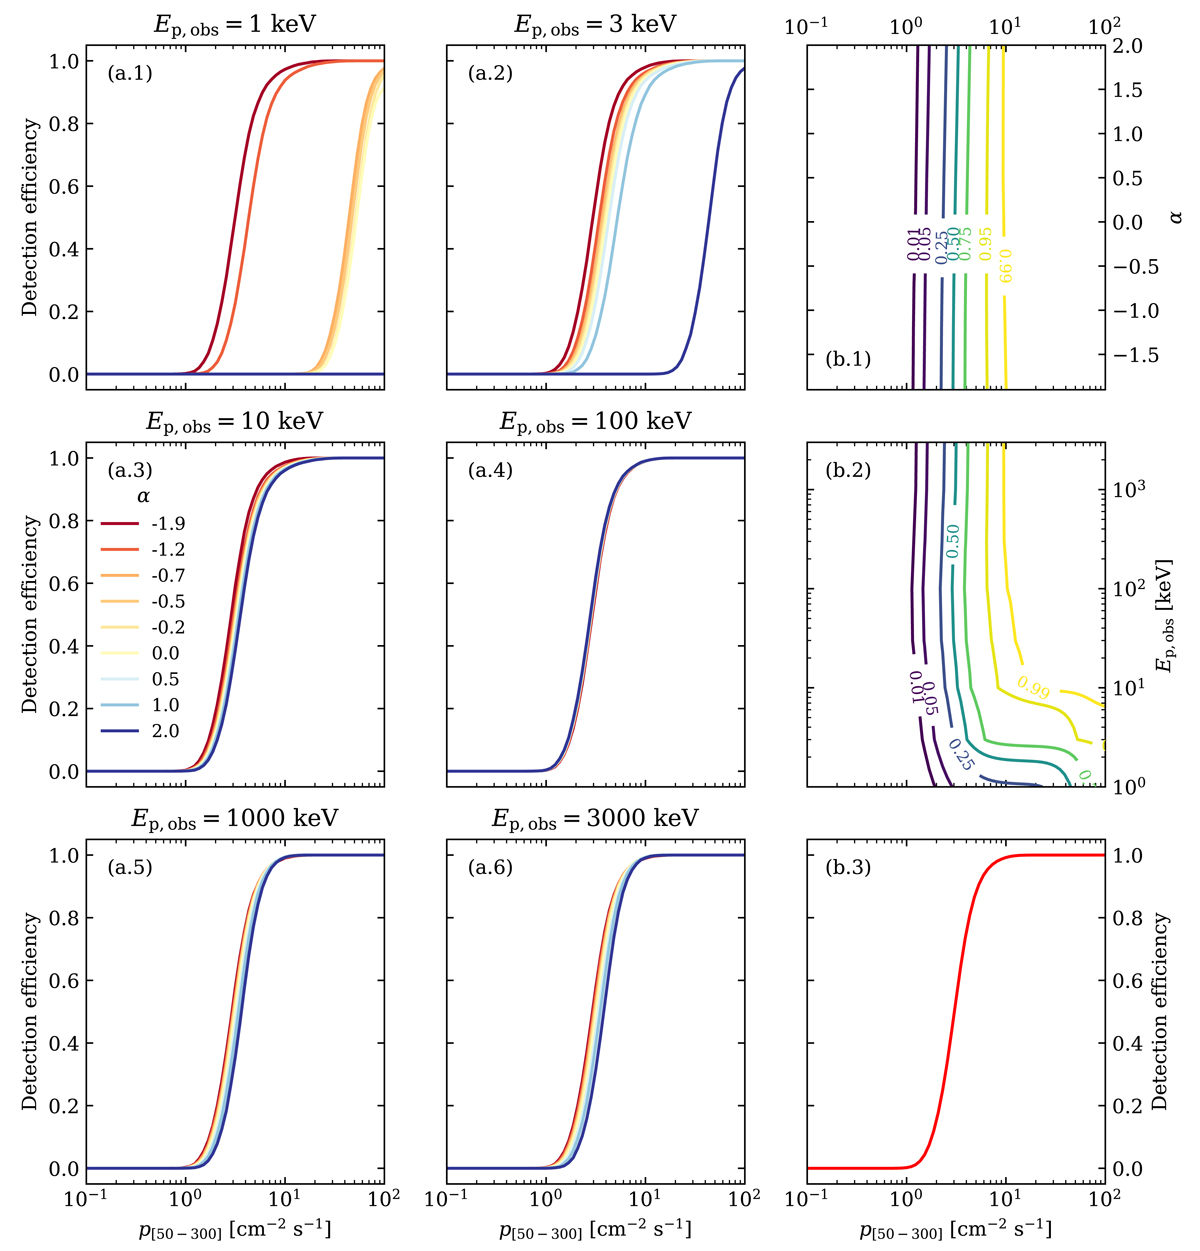
Fig. C.6.
Download original image
Fermi/GBM detection efficiency for SGRBs. Panels (a) show the detection efficiency ηdet, 3D for a fixed value of Ep, obs (reported on top of each panel) and different photon indices α (values shown in the legend), as a function of the 64 ms peak photon flux p[50 − 300]. Panels (b) are obtained by averaging ηdet, 3D over the observed distribution of Ep, obs (panel b.1), that of α (panel b.2), or both (panel b.3). In panels b.1 and b.2, the solid lines are contours of constant averaged ηdet, 2D, with the values reported along each line.
Current usage metrics show cumulative count of Article Views (full-text article views including HTML views, PDF and ePub downloads, according to the available data) and Abstracts Views on Vision4Press platform.
Data correspond to usage on the plateform after 2015. The current usage metrics is available 48-96 hours after online publication and is updated daily on week days.
Initial download of the metrics may take a while.