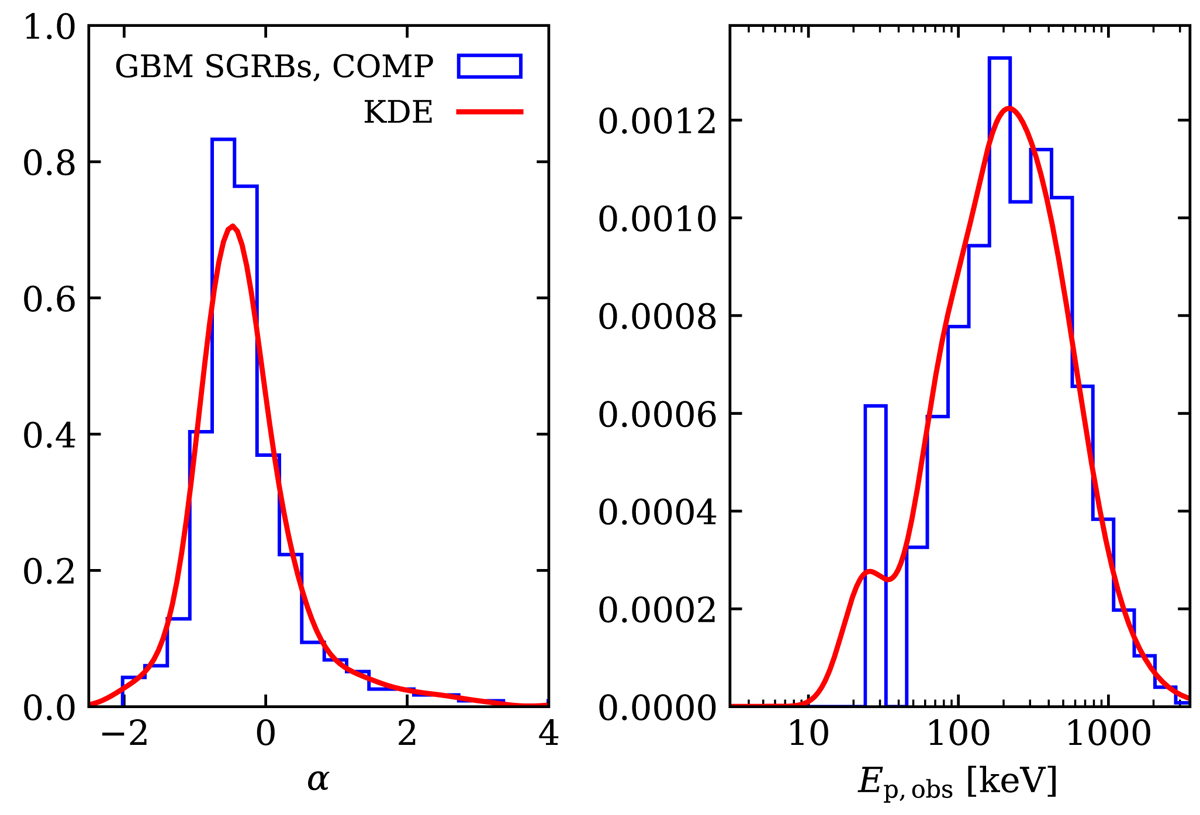
Fig. C.5.
Download original image
Distributions of the low-energy photon index, α, and peak SED photon energy, Ep, obs, within the observed Fermi/GBM sample of SGRBs successfully modelled with the COMP model at peak flux. Blue histograms show density estimates constructed by binning the best-fit values reported in the GBM catalogue. Red lines show the corresponding kernel density estimates.
Current usage metrics show cumulative count of Article Views (full-text article views including HTML views, PDF and ePub downloads, according to the available data) and Abstracts Views on Vision4Press platform.
Data correspond to usage on the plateform after 2015. The current usage metrics is available 48-96 hours after online publication and is updated daily on week days.
Initial download of the metrics may take a while.