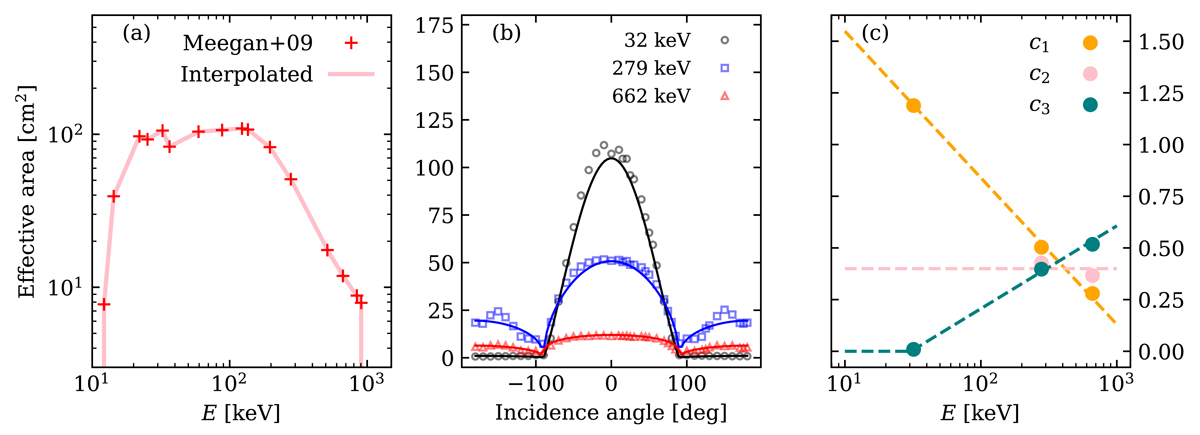
Fig. C.4.
Download original image
NaI detector effective area model. Panel (a) shows the NaI detector effective area measurements (red crosses), for zero incidence angle, reported in M09. The pink line shows our adopted interpolation. Panel (b) shows the measured effective area (M09) for different photon incidence angles at three reference photon energies (black circles: 32 keV; blue squares: 279 keV; red triangles: 662 keV). The solid lines show our best-fitting model. Panel (c) shows the best-fit values of parameters c1, c2 and c3 of our model (Eq. C.5) for the angular dependence of the effective area at the three reference energies (coloured circles). The dashed lines show our assumed behaviour of ci as a function of the photon energy.
Current usage metrics show cumulative count of Article Views (full-text article views including HTML views, PDF and ePub downloads, according to the available data) and Abstracts Views on Vision4Press platform.
Data correspond to usage on the plateform after 2015. The current usage metrics is available 48-96 hours after online publication and is updated daily on week days.
Initial download of the metrics may take a while.