Open Access
Fig. C.3.
Download original image
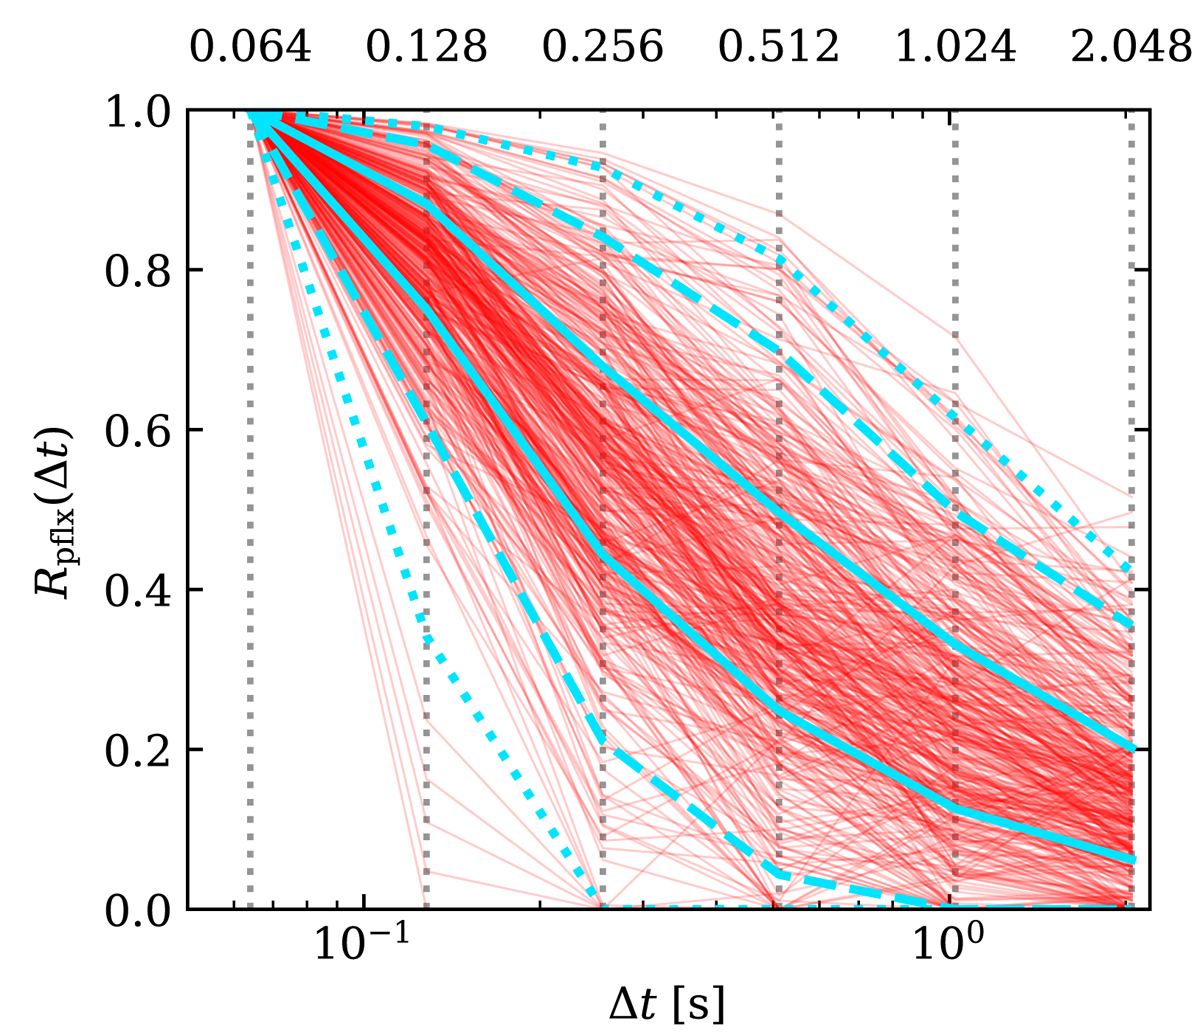
Ratio of SGRB count rate peak flux measured with a Δt binning over that measured with a 64 ms binning. This is constructed using Fermi/GBM trigdata files as explained in the text. Each thin red line corresponds to a single observed SGRB, while the light blue lines mark the 1st, 5th, 25th, 75th, 95th and 99th percentiles.
Current usage metrics show cumulative count of Article Views (full-text article views including HTML views, PDF and ePub downloads, according to the available data) and Abstracts Views on Vision4Press platform.
Data correspond to usage on the plateform after 2015. The current usage metrics is available 48-96 hours after online publication and is updated daily on week days.
Initial download of the metrics may take a while.