Fig. A.1.
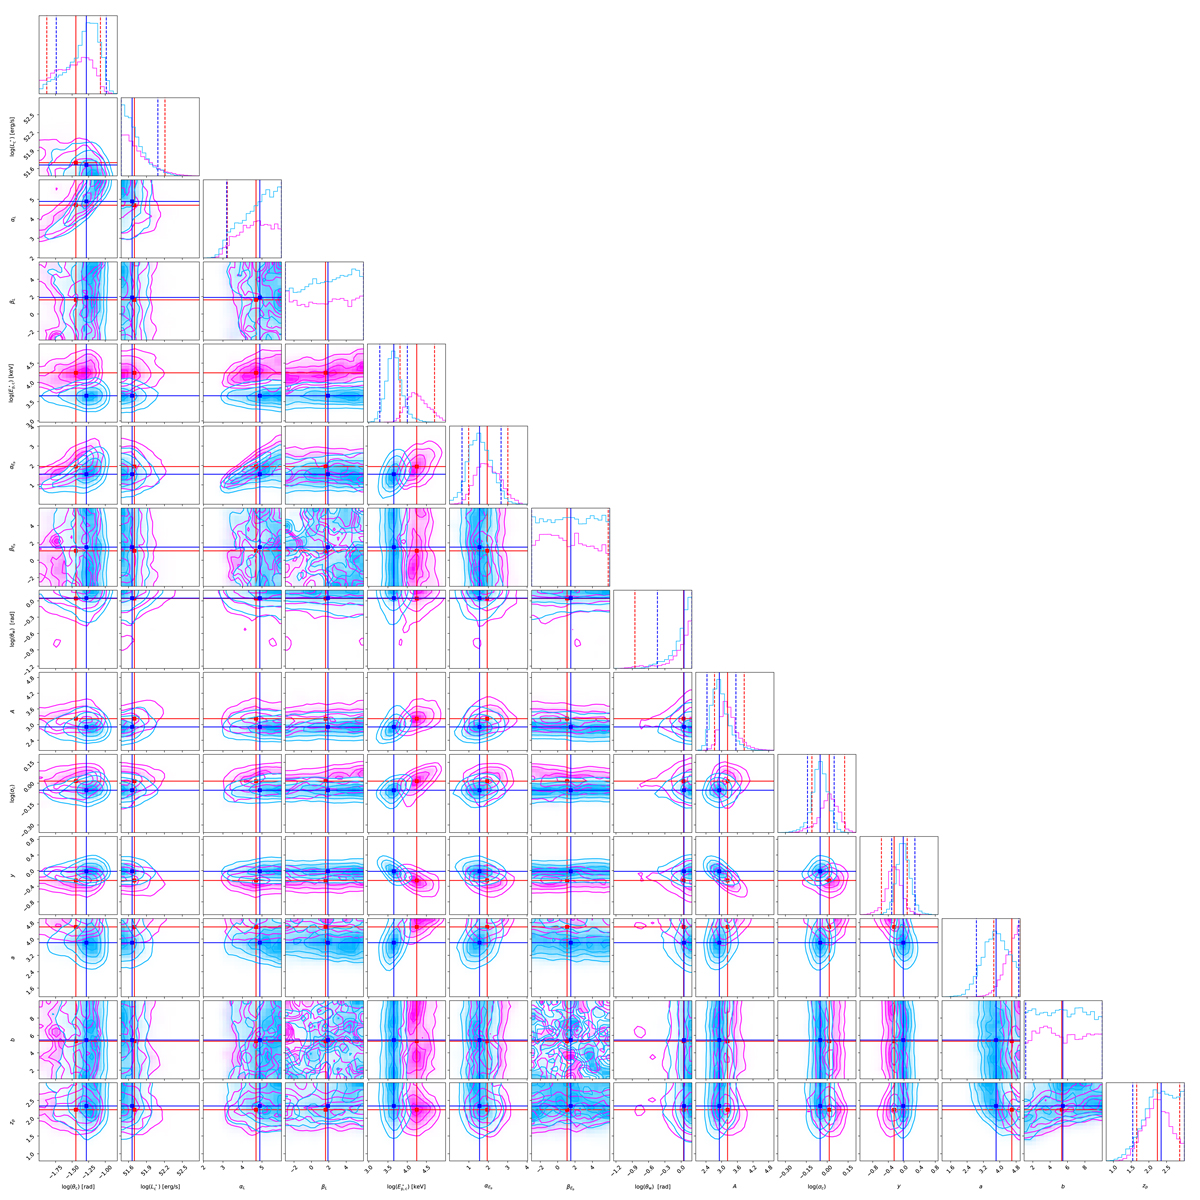
Download original image
Corner plot of the posterior probability densities from the two analyses. The full sample analysis is shown in magenta, while the flux-limited sample analysis is shown in blue. The histograms on the diagonal represent the marginalised posterior probability densities constructed from the posterior samples, with the solid vertical lines marking the medians and the vertical dashed lines delimiting the symmetric 90% credible interval (i.e. the 5th and the 95th percentiles – note that these are not shown if they differ by less than one bin size from the nearest edge of the allowed range). The contours in the remaining panels show the one, two, three and four sigma credible areas from the two-dimensional marginalised joint posterior probability densities, with the dots showing the intersections of the medians of the corresponding one-dimensional marginalised posterior probability densities.
Current usage metrics show cumulative count of Article Views (full-text article views including HTML views, PDF and ePub downloads, according to the available data) and Abstracts Views on Vision4Press platform.
Data correspond to usage on the plateform after 2015. The current usage metrics is available 48-96 hours after online publication and is updated daily on week days.
Initial download of the metrics may take a while.