Fig. 14.
Download original image
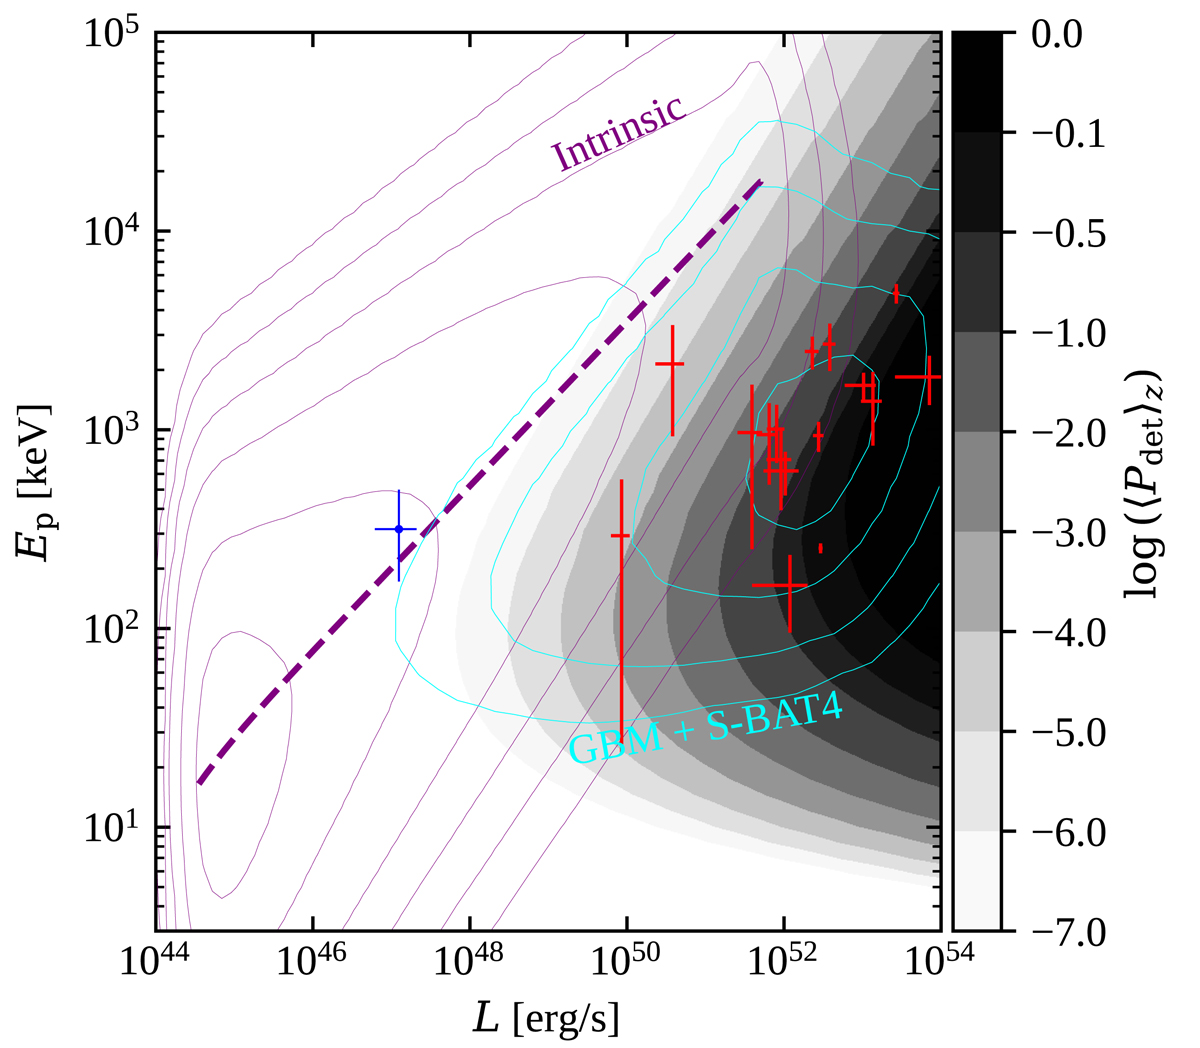
Visualisation of the impact of selection effects on the L–Ep plane. The grey filled contours in the figure show the Fermi/GBM SGRB detection efficiency averaged over redshift, assuming the redshift distribution to be described by our model with parameters corresponding to the median of the population posterior from the full sample analysis (values corresponding to different shades of grey are shown in the colour bar). Purple contours show the areas on the plane that contain 50%, 90%, 99%, 99.9%, 99.99%, and 99.999% of SGRBs in the Universe according to the model. The thick dashed purple line shows the ![]() relation of the model. Cyan contours show the areas that contain 50%, 90%, 99%, and 99.9% of SGRBs that are detected by GBM and have p[15 − 150] > plim, BAT, that is, that pass the selection criteria of our rest-frame sample. Red crosses show SGRBs with known z in our rest-frame sample. GRB 170817A is shown by a blue cross.
relation of the model. Cyan contours show the areas that contain 50%, 90%, 99%, and 99.9% of SGRBs that are detected by GBM and have p[15 − 150] > plim, BAT, that is, that pass the selection criteria of our rest-frame sample. Red crosses show SGRBs with known z in our rest-frame sample. GRB 170817A is shown by a blue cross.
Current usage metrics show cumulative count of Article Views (full-text article views including HTML views, PDF and ePub downloads, according to the available data) and Abstracts Views on Vision4Press platform.
Data correspond to usage on the plateform after 2015. The current usage metrics is available 48-96 hours after online publication and is updated daily on week days.
Initial download of the metrics may take a while.