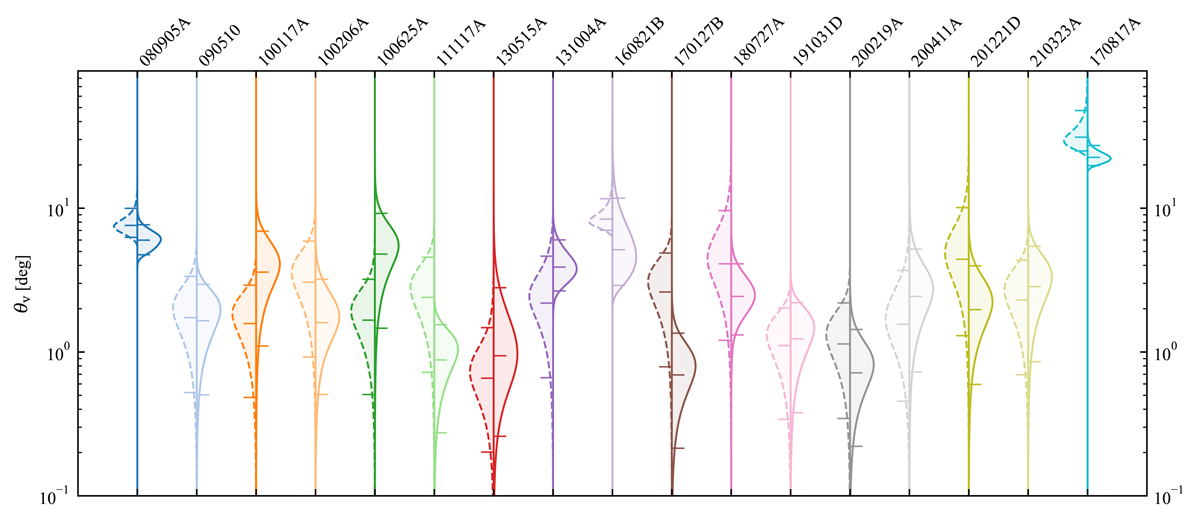
Fig. 13.
Download original image
Viewing angle posterior probability densities for Fermi/GBM SGRBs with known redshifts. For each SGRB with known redshift in our sample, we show the posterior probability density dP/dlnθv, i = θv, iP(θv, i | d) (see Eq. (43)) constructed using 300 population posterior samples from the full sample analysis (solid lines) or the flux-limited sample analysis (dashed lines). Tick marks indicate the 5th, 50th and 95th percentiles of each posterior probability. Individual SGRBs are assigned the same colours as in Fig. 4.
Current usage metrics show cumulative count of Article Views (full-text article views including HTML views, PDF and ePub downloads, according to the available data) and Abstracts Views on Vision4Press platform.
Data correspond to usage on the plateform after 2015. The current usage metrics is available 48-96 hours after online publication and is updated daily on week days.
Initial download of the metrics may take a while.