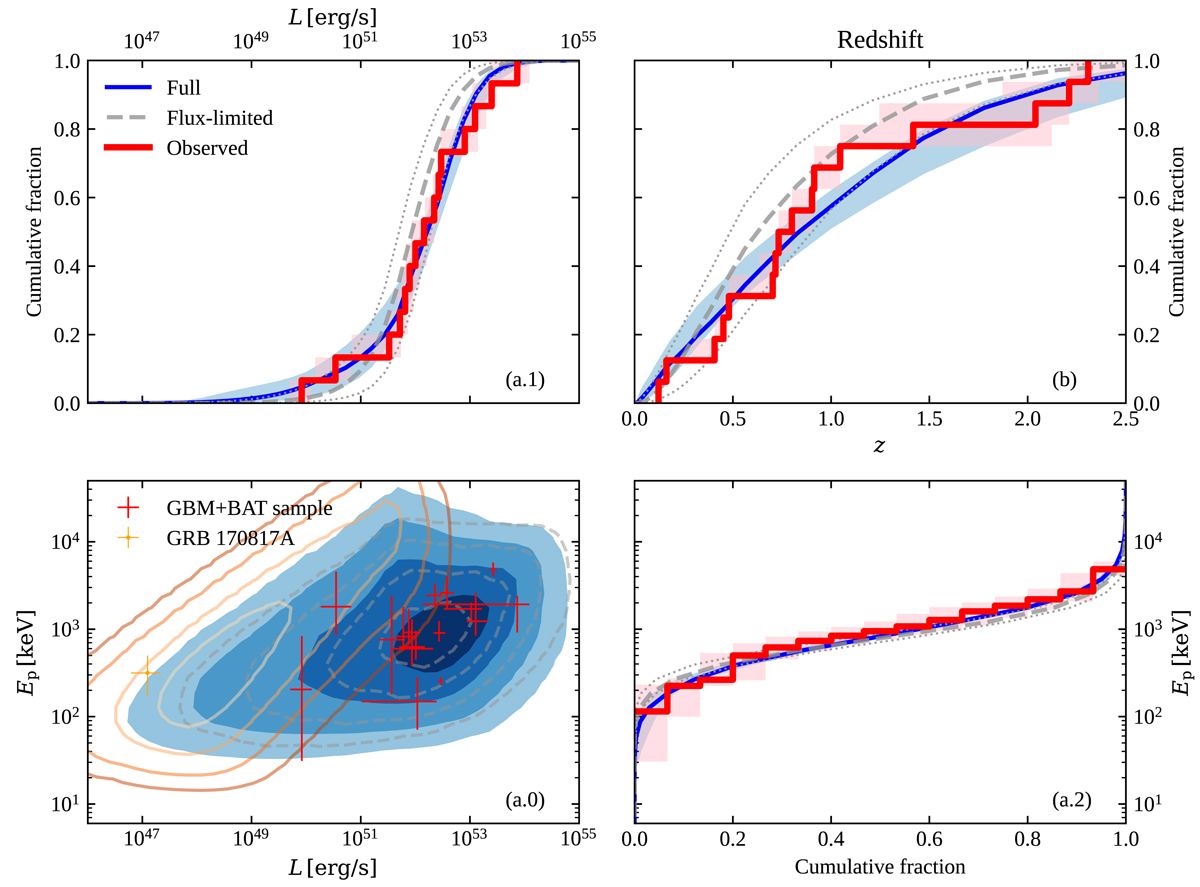
Fig. 12.
Download original image
Rest-frame sample, viewing angle sample, and model predictions. This is similar to Fig. 11, but for rest-frame quantities L and Ep. Panel a.0 shows the predicted smallest regions in the (L, Ep) plane where 50%, 90%, 99% and 99.9% of the SGRBs that are detected by Fermi/GBM and by Swift/BAT with p[15 − 150] > plim, BAT are located, according to our model, using the parameters at the median of the λpop posterior (filled blue contours: full sample analysis; dashed grey contours: flux-limited sample analysis). Red crosses show the SGRBs with a measured redshift in our rest-frame sample. Panels a.1, a.2 and b show the predicted (blue solid lines: full sample; grey dashed lines: flux-limited sample) and observed (red cumulative histograms, with pink shaded areas showing the 90% confidence regions) cumulative distributions of luminosities (panel a.1), Ep (panel a.2), and redshifts (panel b). In panels a.1, a.2 and b, the 90% credible bands stemming from the uncertainty on λpop are shown with blue shading (full sample) and dotted lines (flux-limited sample). The additional orange contours in panel a.0 show the 50%, 90%, 99% and 99.9% containment regions for SGRBs with a BNS merger counterpart detected by Fermi/GBM and by the aLIGO and Advanced Virgo detectors with O3 sensitivity. The orange cross shows the position of GRB 170817A on the plane.
Current usage metrics show cumulative count of Article Views (full-text article views including HTML views, PDF and ePub downloads, according to the available data) and Abstracts Views on Vision4Press platform.
Data correspond to usage on the plateform after 2015. The current usage metrics is available 48-96 hours after online publication and is updated daily on week days.
Initial download of the metrics may take a while.