Fig. 11.
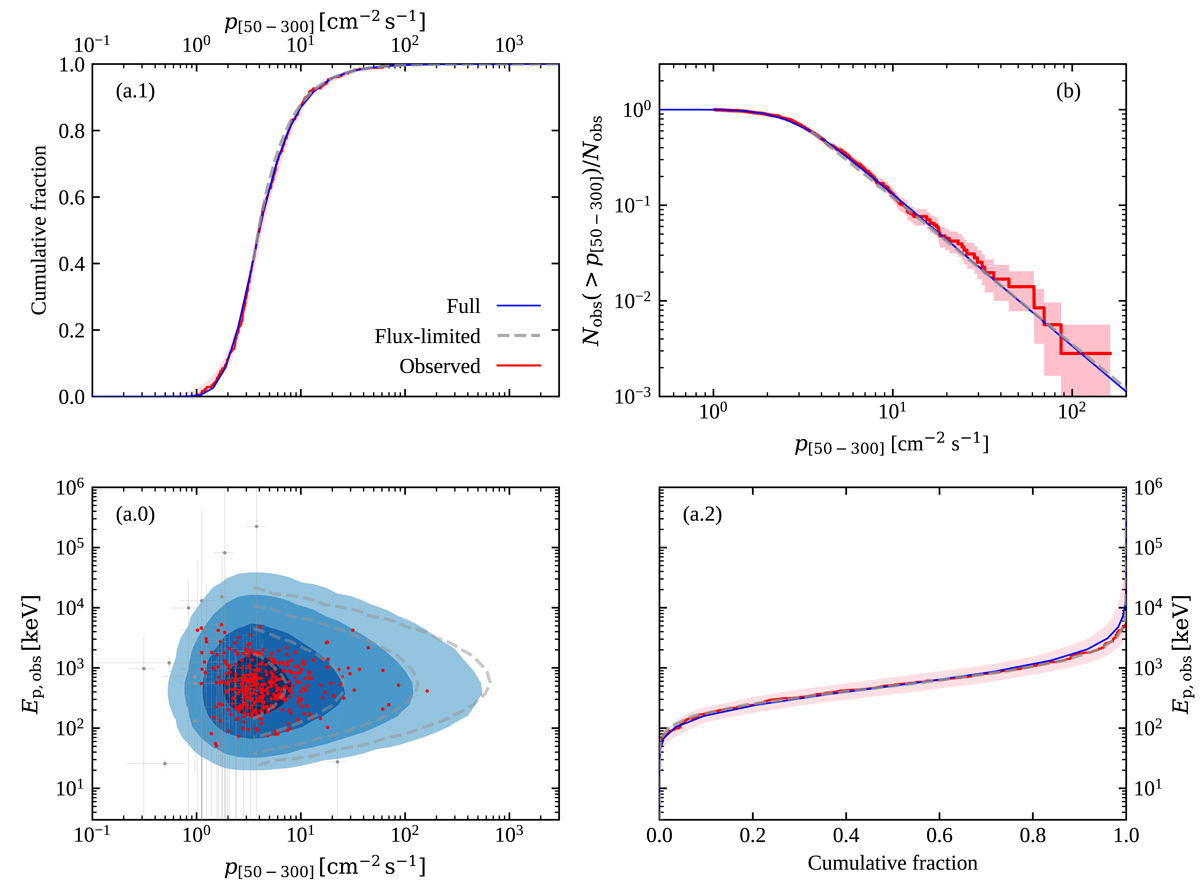
Download original image
Observer-frame constraints and best-fit model predictions. Panel a.0 shows the predicted distribution of Fermi/GBM SGRBs on the (p[50 − 300], Ep, obs) plane for our best-fit model, with progressively lighter contours containing 50%, 90%, 99% and 99% of the events. Red dots show the observed data reported in the Fermi/GBM catalogue that pass our additional quality cuts, while grey points show the events that are discarded. We additionally show the error bars with thin grey lines for those events with a relative error larger than 50% on either quantity, or both. Panels a.1 and a.2 show the predicted (solid blue line) and observed (solid red cumulative histogram, with the pink region showing the 90% confidence region that stems from statistical uncertainties on spectral fitting parameters) cumulative distributions of p[50 − 300] (panel a.1) and Ep, obs (panel a.2) for events that pass the quality cuts. Panel b shows the inverse cumulative distribution of p[50 − 300], highlighting the behaviour at the high-flux end, which follows the expected ![]() trend. Panel b uses the same conventions as panels a.1 and a.2, except the shaded pink region shows the one-sigma equivalent Poisson error.
trend. Panel b uses the same conventions as panels a.1 and a.2, except the shaded pink region shows the one-sigma equivalent Poisson error.
Current usage metrics show cumulative count of Article Views (full-text article views including HTML views, PDF and ePub downloads, according to the available data) and Abstracts Views on Vision4Press platform.
Data correspond to usage on the plateform after 2015. The current usage metrics is available 48-96 hours after online publication and is updated daily on week days.
Initial download of the metrics may take a while.