Fig. 1.
Download original image
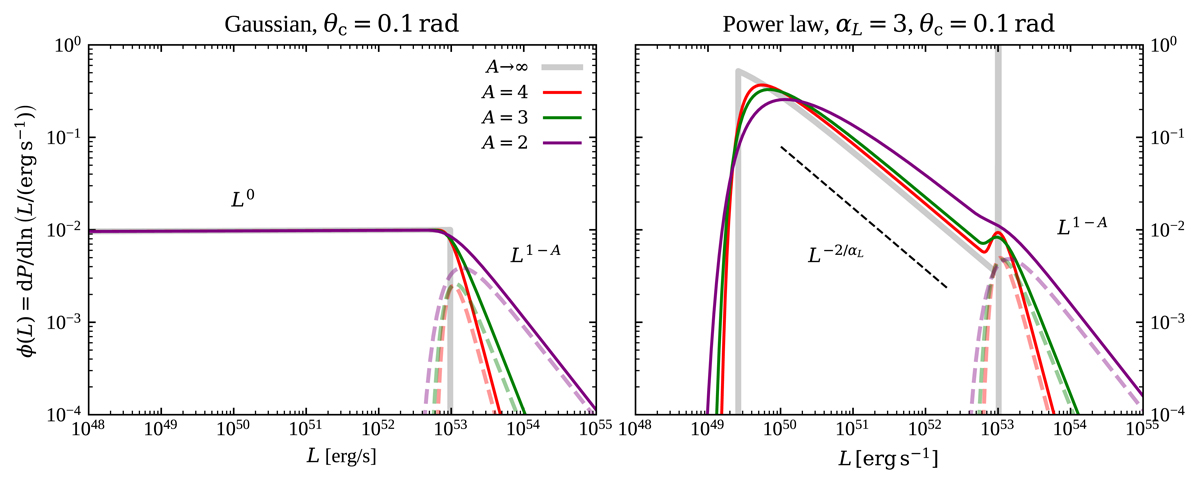
Example luminosity functions ϕ(L) = dP/dln(L) induced by a Gaussian apparent structure model (Eqs. (10), left-hand panel) and a power law apparent structure model (Eqs. (13)) with a luminosity profile slope α = 3 (right-hand panel), both with a core half-opening angle θc = 0.1 rad and ![]() = 1053 erg s−1. In each panel, the luminosity function corresponding to a population with zero core dispersion (A → ∞ in Eq. (2)) is shown in grey, and three cases with different core luminosity distributions (slopes reported in the legend) are shown with coloured lines. The corresponding Lc distributions (arbitrarily scaled) are shown with dashed lines. In the right-hand panel, the dashed black line shows the trend ϕ(L)∝L−2/αL expected at intermediate luminosities.
= 1053 erg s−1. In each panel, the luminosity function corresponding to a population with zero core dispersion (A → ∞ in Eq. (2)) is shown in grey, and three cases with different core luminosity distributions (slopes reported in the legend) are shown with coloured lines. The corresponding Lc distributions (arbitrarily scaled) are shown with dashed lines. In the right-hand panel, the dashed black line shows the trend ϕ(L)∝L−2/αL expected at intermediate luminosities.
Current usage metrics show cumulative count of Article Views (full-text article views including HTML views, PDF and ePub downloads, according to the available data) and Abstracts Views on Vision4Press platform.
Data correspond to usage on the plateform after 2015. The current usage metrics is available 48-96 hours after online publication and is updated daily on week days.
Initial download of the metrics may take a while.