Open Access
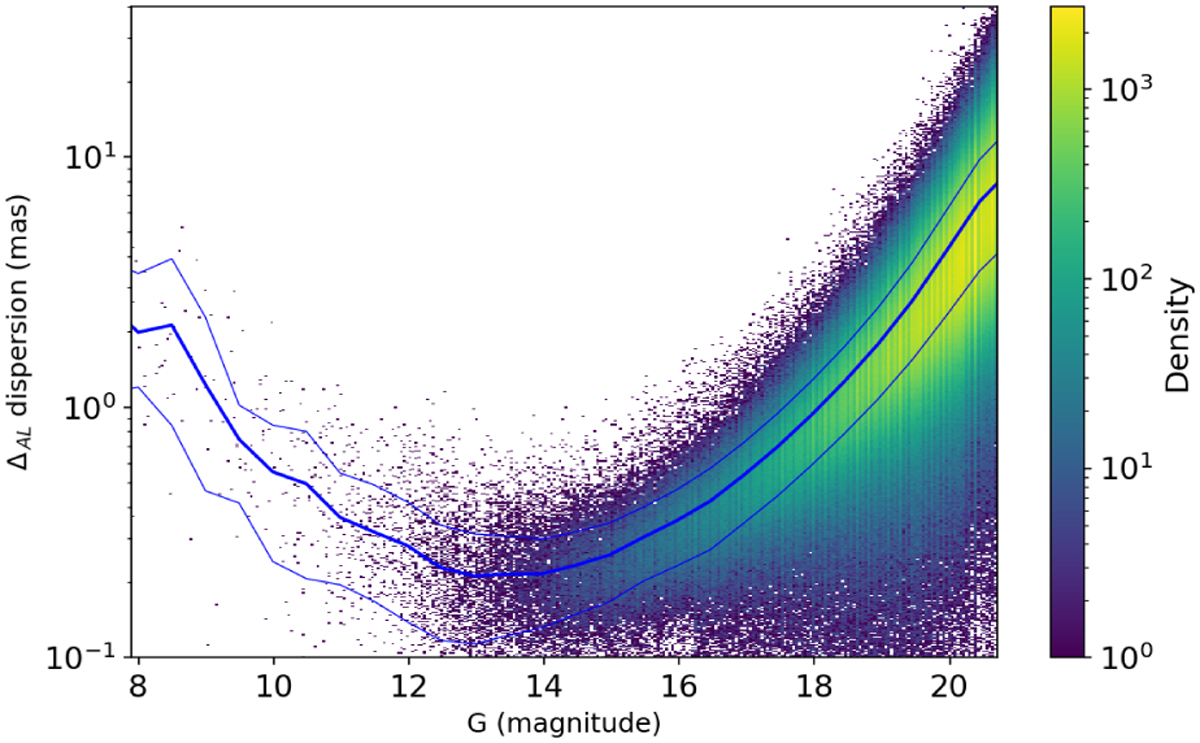
Fig. 8
Download original image
Standard deviation of the values of the along-scan residuals for each CCD, computed over each transit. The colour corresponds to the point density. The lines represent the smoothed average, and the quan-tiles at the 1σ level.
Current usage metrics show cumulative count of Article Views (full-text article views including HTML views, PDF and ePub downloads, according to the available data) and Abstracts Views on Vision4Press platform.
Data correspond to usage on the plateform after 2015. The current usage metrics is available 48-96 hours after online publication and is updated daily on week days.
Initial download of the metrics may take a while.