Fig. 6
Download original image
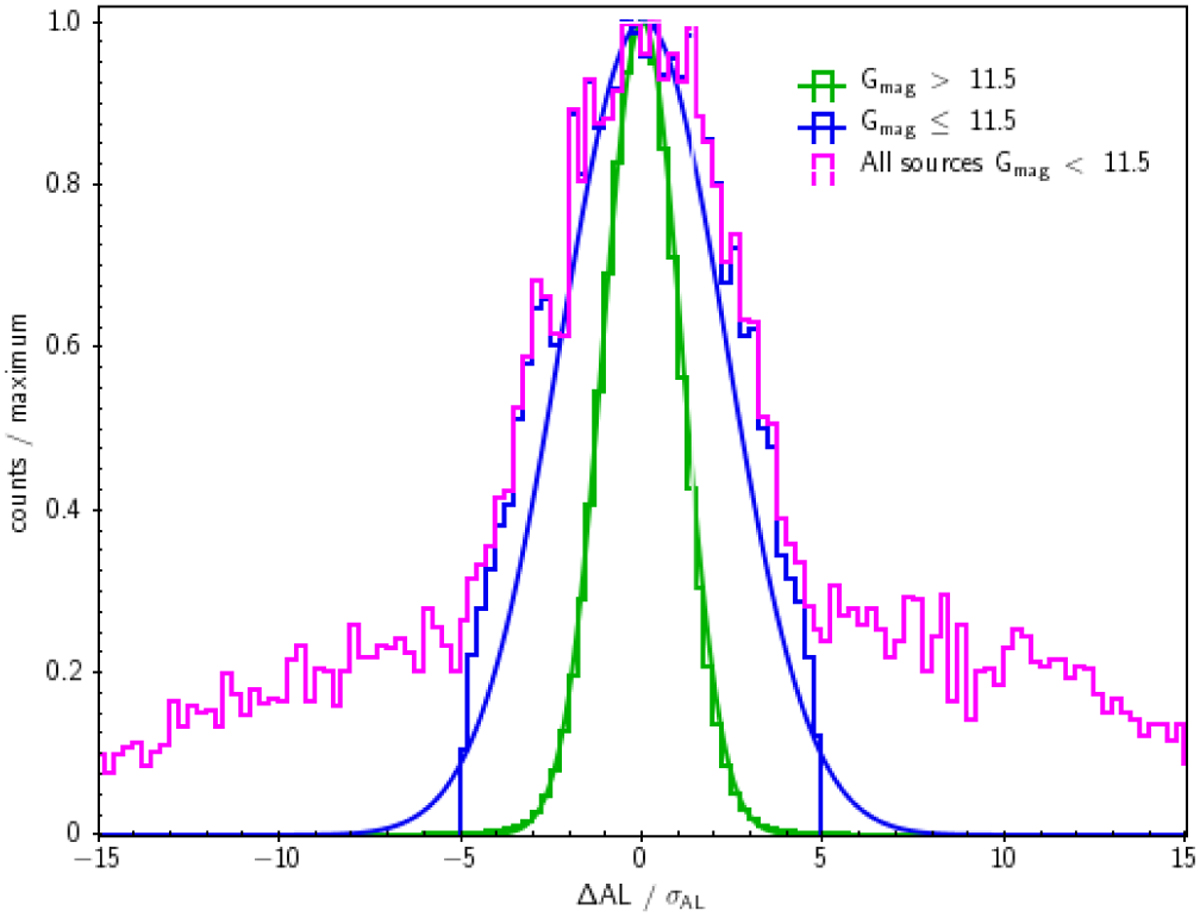
Histograms of the along-scan residuals normalised to the formal uncertainties for the accepted solutions with Gmag ≤ 11.5 shown in blue or Gmag > 11.5 shown in green. The histogram in magenta shows all sources (accepted or rejected) with Gmag ≤ 11.5. A Gaussian fit to the data is shown as well. We note that for sources with Gmag > 11.5, the distribution is very well represented by a Gaussian (μ = 0.018, σ = 1.08), but for Gmag ≤ 11.5, the distribution is clearly not Gaussian.
Current usage metrics show cumulative count of Article Views (full-text article views including HTML views, PDF and ePub downloads, according to the available data) and Abstracts Views on Vision4Press platform.
Data correspond to usage on the plateform after 2015. The current usage metrics is available 48-96 hours after online publication and is updated daily on week days.
Initial download of the metrics may take a while.