Fig. 8
Download original image
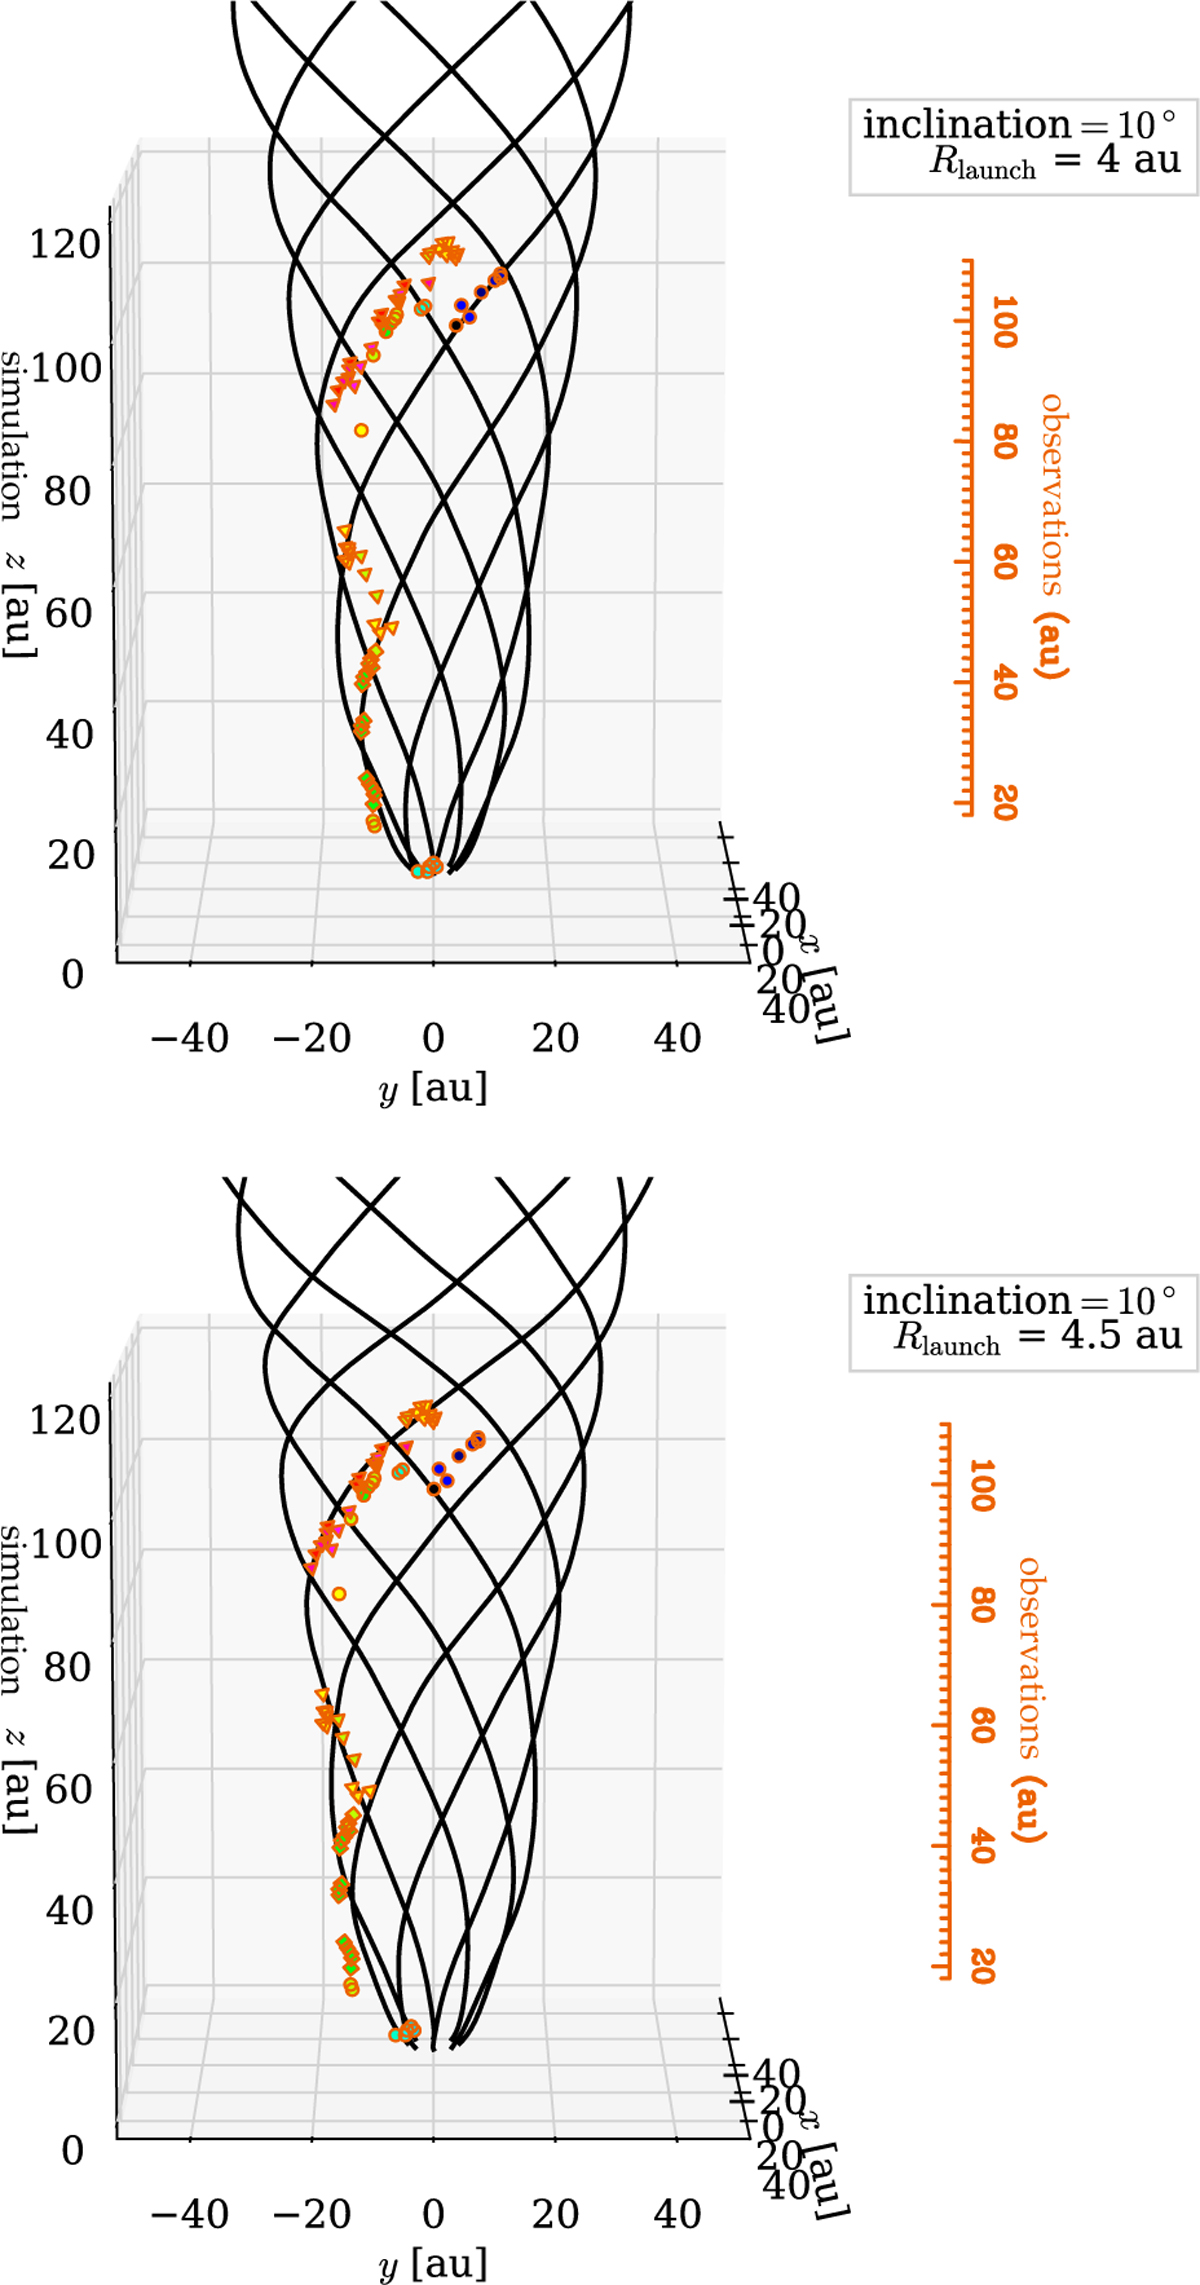
Observations compared with simulations for the streamlines in the NE region. Dots, triangles, and squares have the same meaning as in Fig. 4. The black curves are the plane-of-the-sky projection of the simulated DW streamlines for the masers in the NE region. Two slightly different launch radii of 4 (upper panel) and 4.5 au (lower panel) are used to reproduce the NE-3 (squares) and NE-2 (triangles) streams, respectively. We note that the observations are rotated 50° clockwise so as to align the jet axis with the vertical axis.
Current usage metrics show cumulative count of Article Views (full-text article views including HTML views, PDF and ePub downloads, according to the available data) and Abstracts Views on Vision4Press platform.
Data correspond to usage on the plateform after 2015. The current usage metrics is available 48-96 hours after online publication and is updated daily on week days.
Initial download of the metrics may take a while.