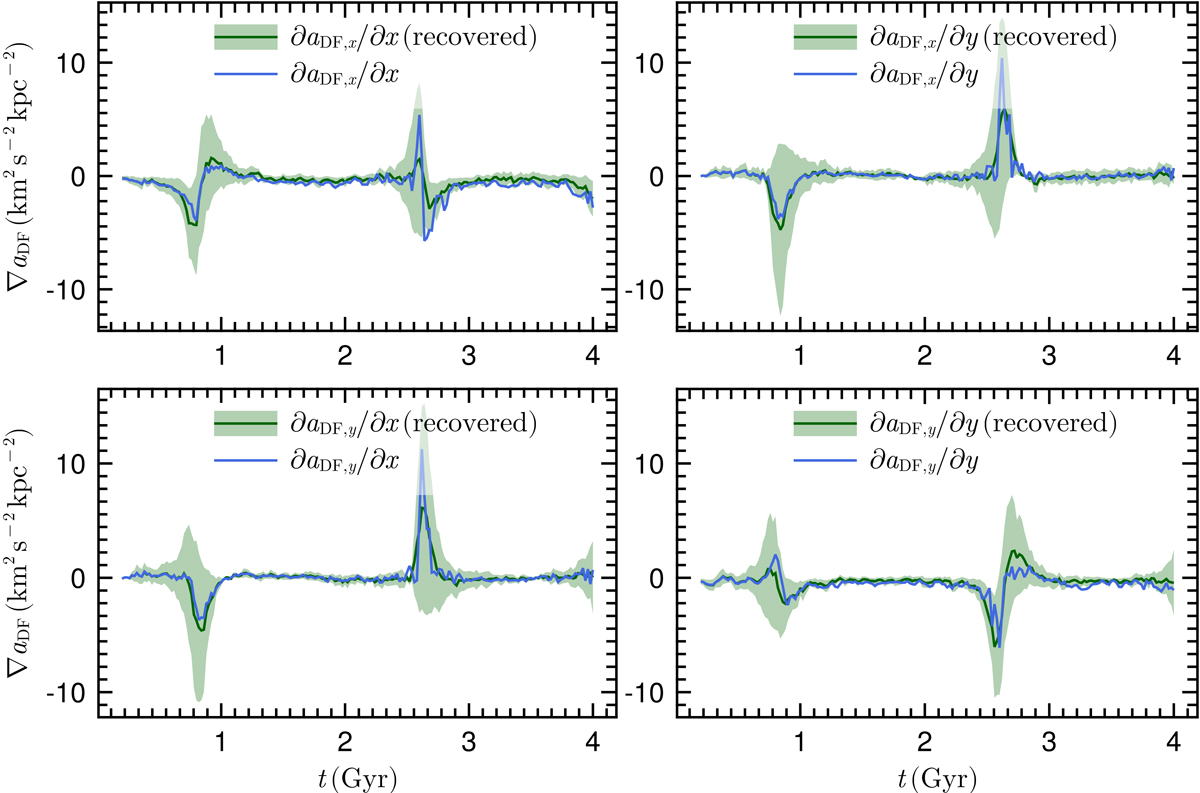
Fig. 6.
Download original image
Recovery of the tides from dynamical friction for the fiducial case (see Table 2 for numeric characterisation of the recovery). Each panel shows one component of the tides. The ratio of residuals and uncertainty are shown in Fig. 7. The uncertainty (green corridor) was evaluated from the summing in Eqs. (2) and (1) in the recovery case (green line). We note that the uncertainty is not normally distributed. The blue line shows the actual value.
Current usage metrics show cumulative count of Article Views (full-text article views including HTML views, PDF and ePub downloads, according to the available data) and Abstracts Views on Vision4Press platform.
Data correspond to usage on the plateform after 2015. The current usage metrics is available 48-96 hours after online publication and is updated daily on week days.
Initial download of the metrics may take a while.