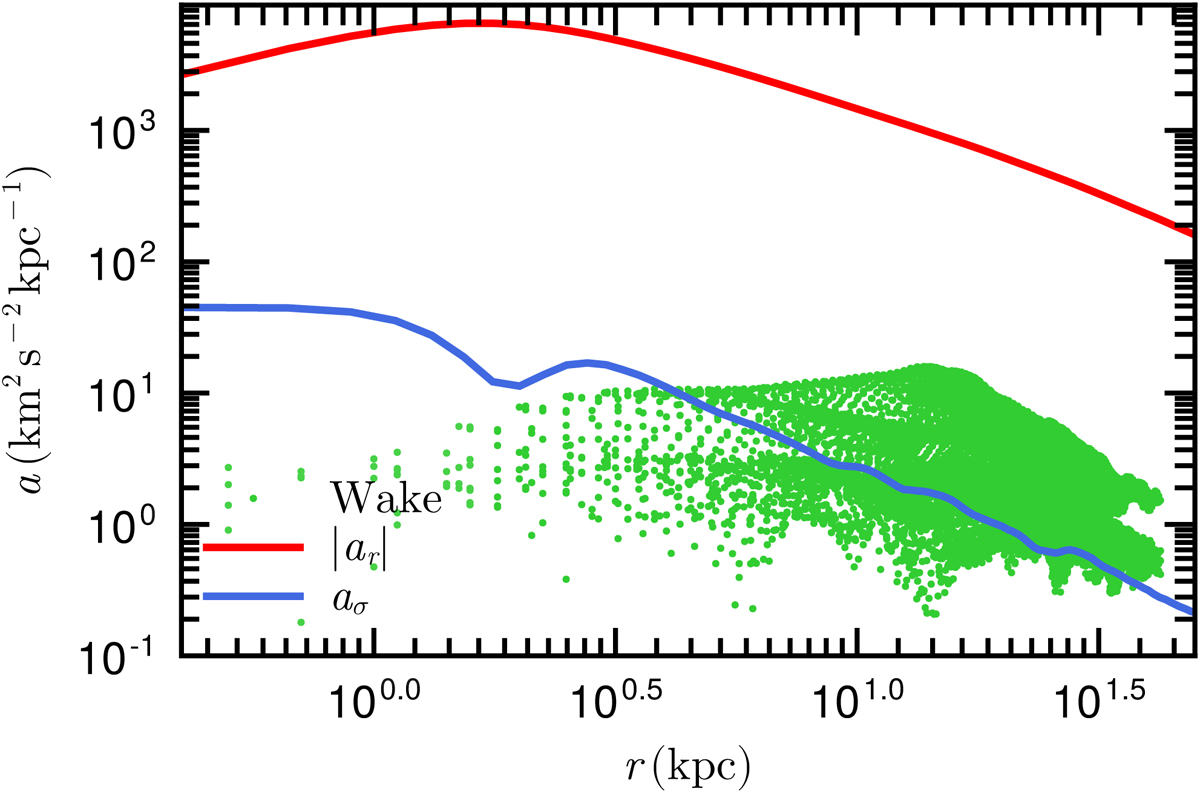
Fig. 3.
Download original image
Comparison of different acceleration components in the simulations. The red line depicts the spherical acceleration field of the unperturbed host’s galaxy at t ≈ 0.8 Gyr (orange cross in Fig. 2). The origin of r is the host’s centre. The blue line shows the estimated noise from the host (see text for details), and the green points show the acceleration from various wake points, as in Fig. 5. For comparison, the perturber causes an acceleration of 43 km2 s−2 kpc−1 at 10 kpc from the system’s centre.
Current usage metrics show cumulative count of Article Views (full-text article views including HTML views, PDF and ePub downloads, according to the available data) and Abstracts Views on Vision4Press platform.
Data correspond to usage on the plateform after 2015. The current usage metrics is available 48-96 hours after online publication and is updated daily on week days.
Initial download of the metrics may take a while.