Fig. 4.
Download original image
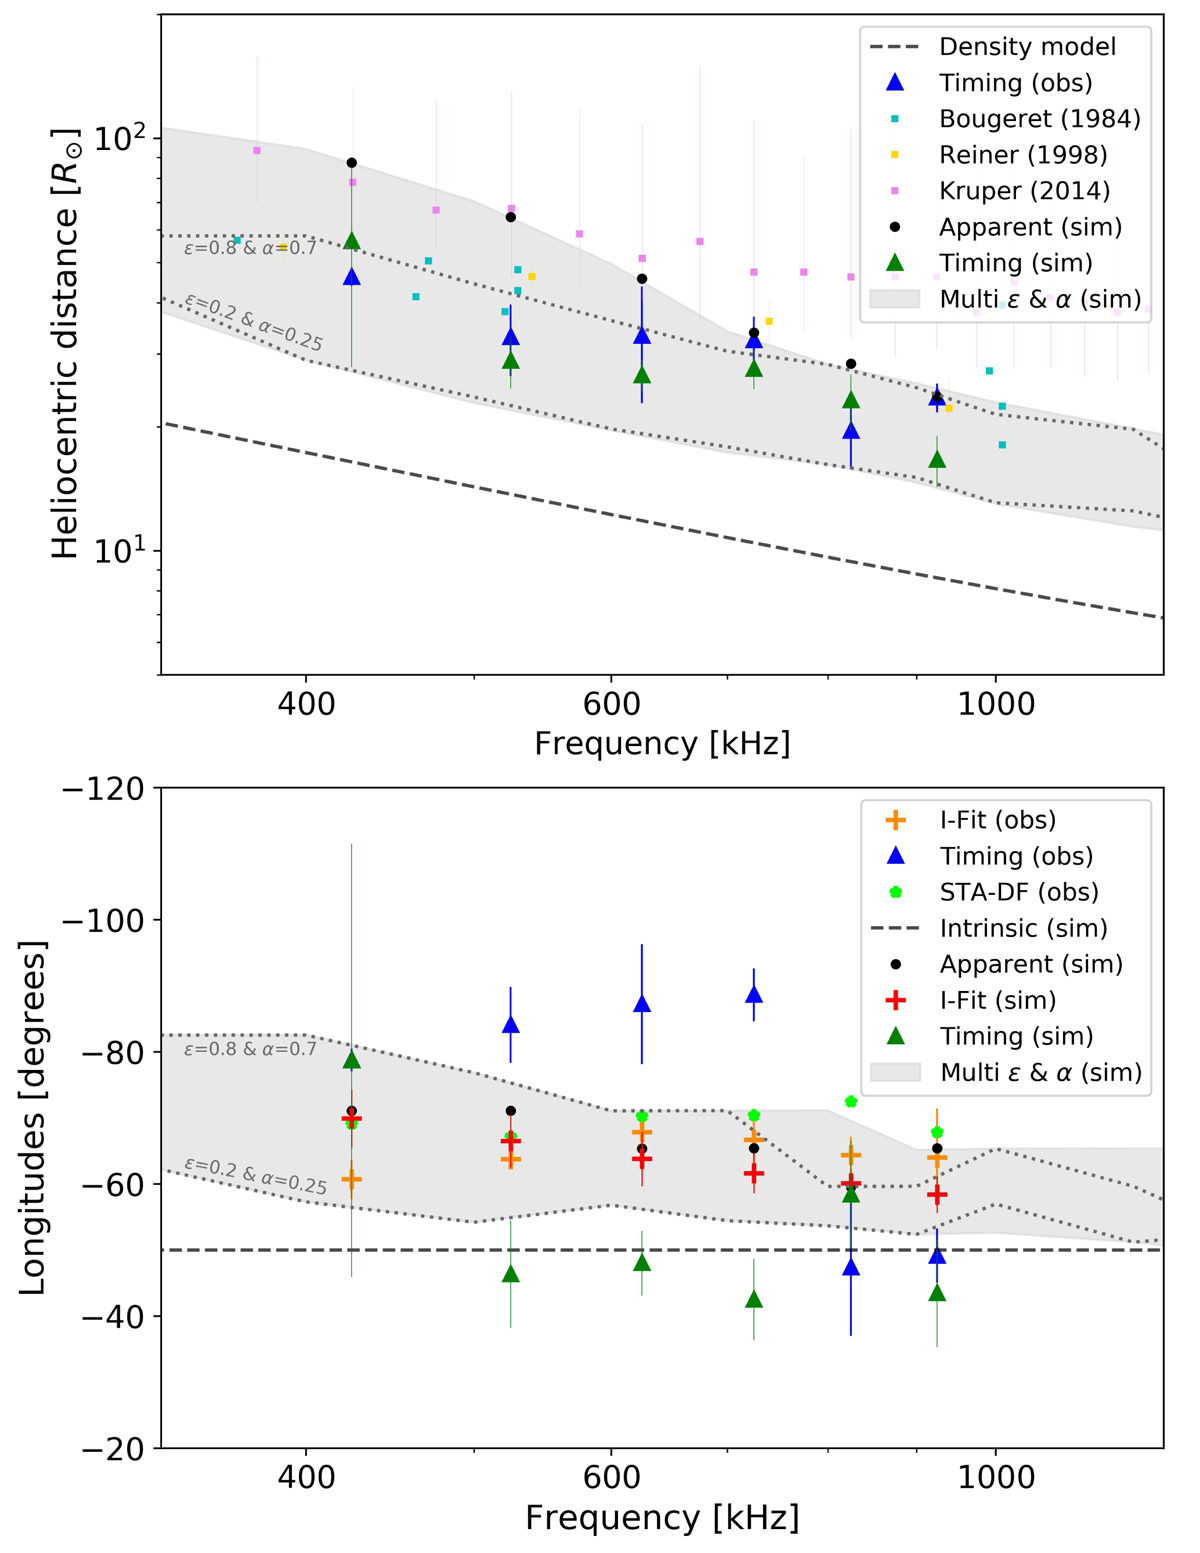
Heliocentric distances (upper panel) and longitudes (lower panel) of the source were deduced from observations of four spacecraft (obs) and simulations (sim) of radio wave propagation for anisotropic scattering effects. The dashed line represents the radial distance calculated from the density model, which corresponds to the heliocentric distances of the true source. The referenced distances of the IP type III bursts from spacecraft observations were obtained from previous studies (Bougeret et al. 1984; Reiner et al. 1998b; Krupar et al. 2014). The source positions deduced from the intensity fit and timing method, based on the intensity profiles in the simulations (with ϵ = 0.8 and α = 0.3), are depicted as red plus symbols and dark green triangle symbols, respectively. The gray shadow indicates the apparent source positions obtained from simulations considering a range of ϵ values from 0.2 to 0.8 and α values from 0.25 to 0.7. The green symbols (STA-DF) indicate the directions of this type III burst as determined by the DF measurement of STEREO-A.
Current usage metrics show cumulative count of Article Views (full-text article views including HTML views, PDF and ePub downloads, according to the available data) and Abstracts Views on Vision4Press platform.
Data correspond to usage on the plateform after 2015. The current usage metrics is available 48-96 hours after online publication and is updated daily on week days.
Initial download of the metrics may take a while.