Fig. 3.
Download original image
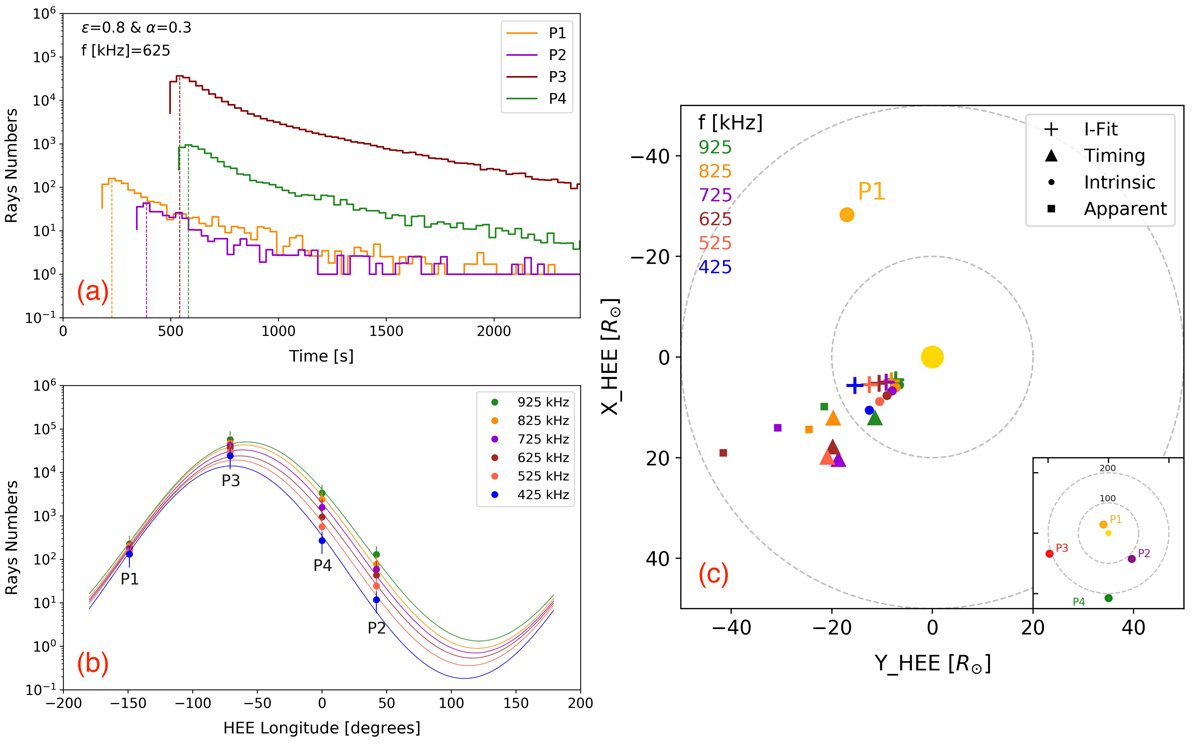
Simulation results. (a) Time profiles at 625 kHz for multiple viewing angles. The collection of rays is restricted to latitudes within the range of 0.85 < cos ϕ < 1. The times of the peak flux are marked as vertical dashed lines. (b) Intensity fit results. The four viewing longitudes are −149° (P1), 42° (P2), −71° (P3), and 0° (P4) degrees. The flux errors were set at 50% of the peak fluxes and are displayed as vertical lines. (c) Positions of the intrinsic source (initial positions determined based on the density model; solid circle symbols), the apparent source (deduced from scattering simulations; solid square symbols), as well as source positions derived from intensity fits (plus symbols) and timing method (solid triangle symbols).
Current usage metrics show cumulative count of Article Views (full-text article views including HTML views, PDF and ePub downloads, according to the available data) and Abstracts Views on Vision4Press platform.
Data correspond to usage on the plateform after 2015. The current usage metrics is available 48-96 hours after online publication and is updated daily on week days.
Initial download of the metrics may take a while.