Fig. 2.
Download original image
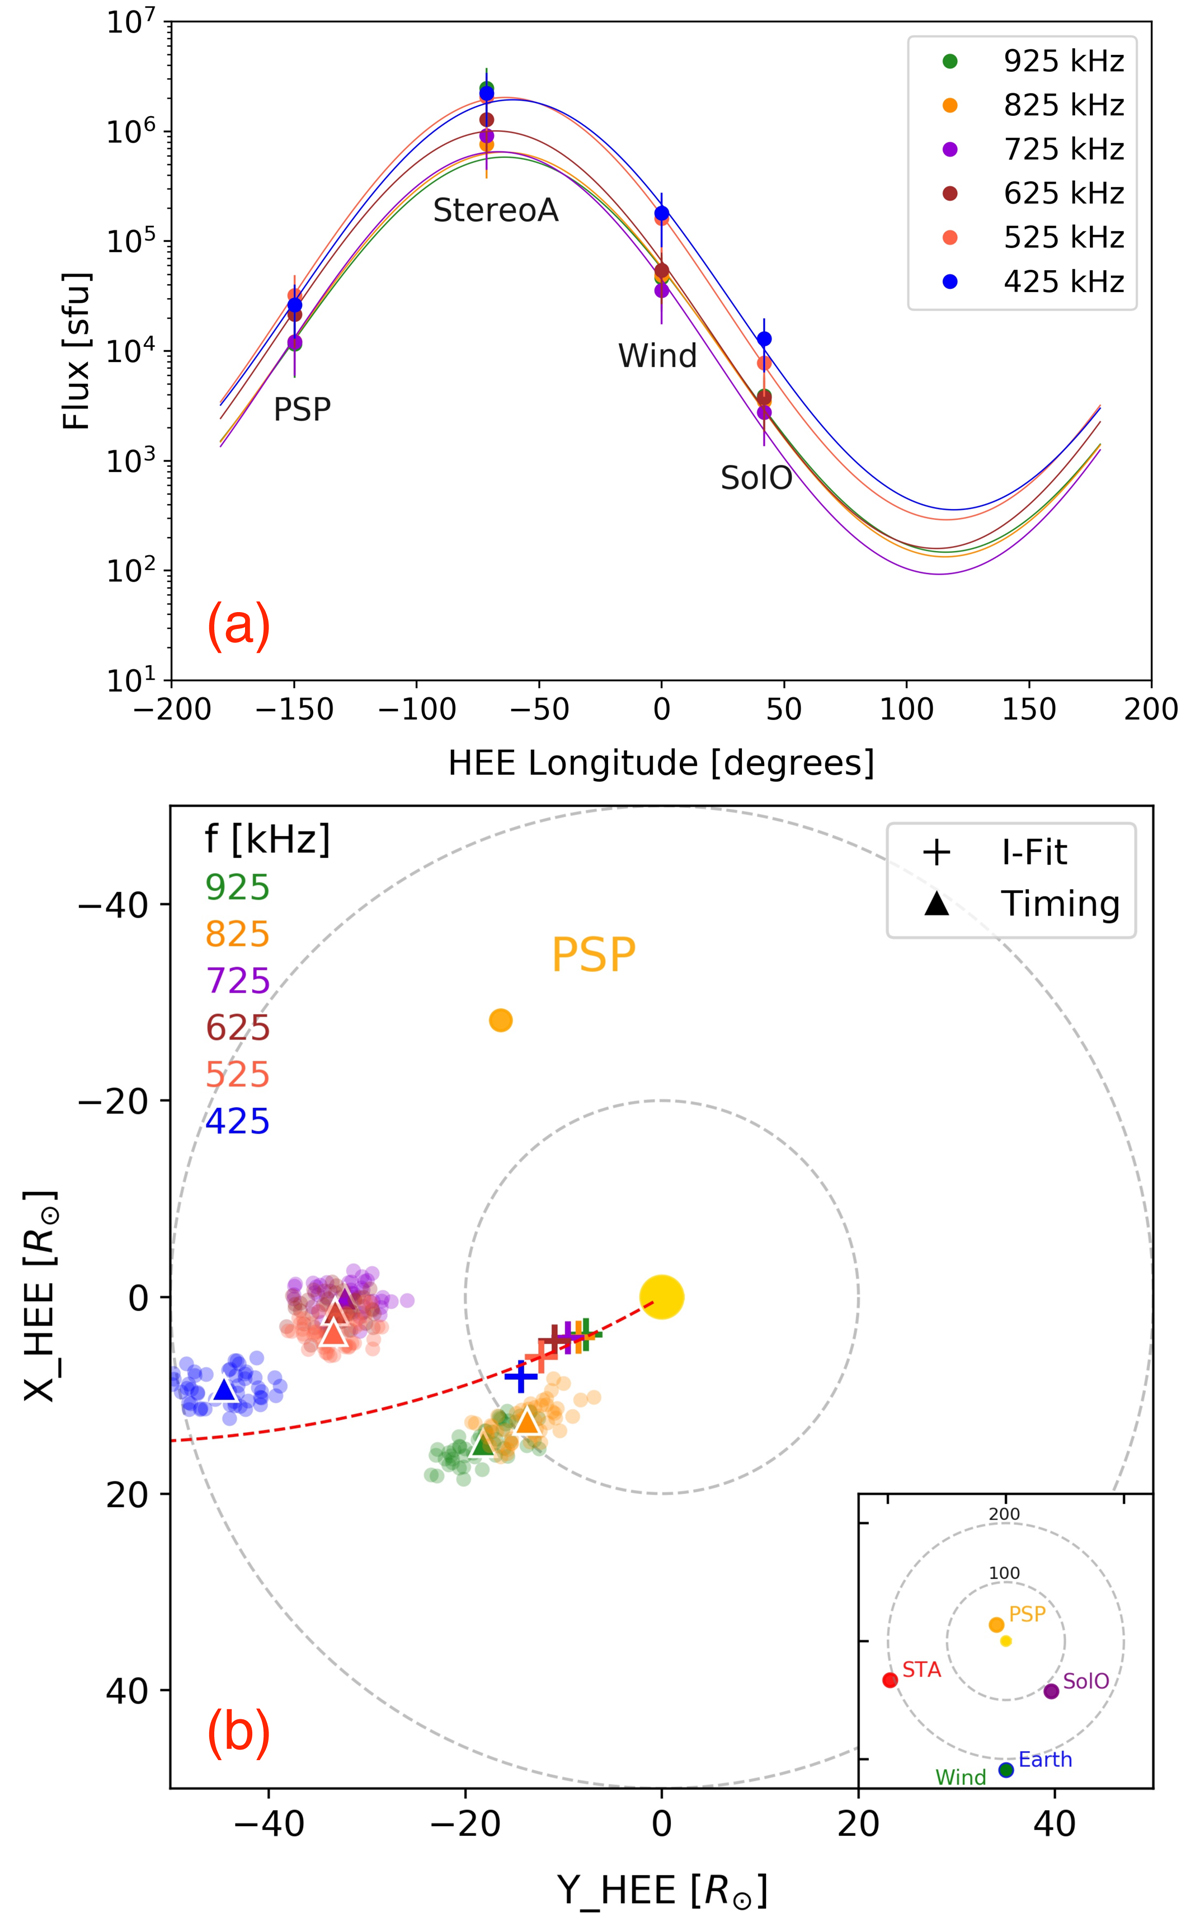
Observation results. (a) Intensity fit result: The peak fluxes at each frequency, corresponding to the longitudes of the four probes, are denoted by points. Vertical lines show the uncertainty, which is given to be 50% of the peak fluxes. The curves represent the best-fitted fluxes obtained using Eq. (1). (b) Source positions: The source positions were determined using both the intensity fit (plus symbols) and timing method (triangle symbols) at six frequencies. The shaded dots indicate the positions determined from the timing method by sampling peak times varied by tpk ± Δt, while the triangle symbols show average positions of those sampling dots. The Parker spiral, with a solar wind speed of 400 km s−1, is connected back to the Sun at −60° and indicated as a red dashed line. In the lower right corner panel, the positions of PSP (P1), SolO (P2), STEREO-A (P3), and Wind (P4) are projected onto the plane of the Earth’s orbit in the Heliocentric Earth ecliptic (HEE) coordinate system. The dashed circles represent 100 and 200 times the solar radius.
Current usage metrics show cumulative count of Article Views (full-text article views including HTML views, PDF and ePub downloads, according to the available data) and Abstracts Views on Vision4Press platform.
Data correspond to usage on the plateform after 2015. The current usage metrics is available 48-96 hours after online publication and is updated daily on week days.
Initial download of the metrics may take a while.