Fig. 8
Download original image
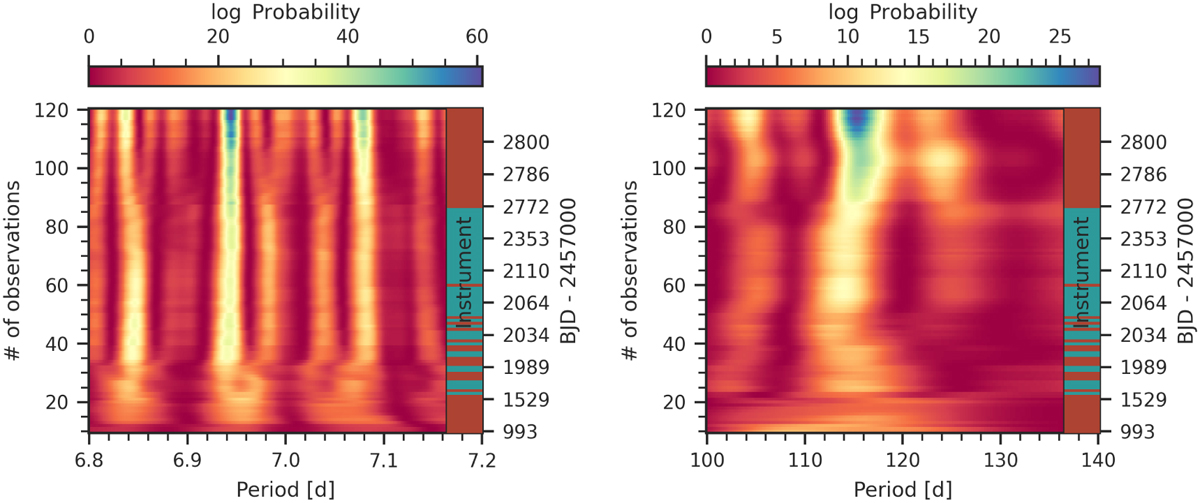
Same as Fig. 5 but for GJ 3988. In the instrument coloured bar, CARMENES is shown in orange-red, while IRD in bluish-green. Left panel is centred on the 6.94-day signal, after subtracting the stellar activity using a GP model. Right panel is centred on the imprint of the mean stellar rotation period after subtracting the 6.94-day signal from the data.
Current usage metrics show cumulative count of Article Views (full-text article views including HTML views, PDF and ePub downloads, according to the available data) and Abstracts Views on Vision4Press platform.
Data correspond to usage on the plateform after 2015. The current usage metrics is available 48-96 hours after online publication and is updated daily on week days.
Initial download of the metrics may take a while.