Open Access
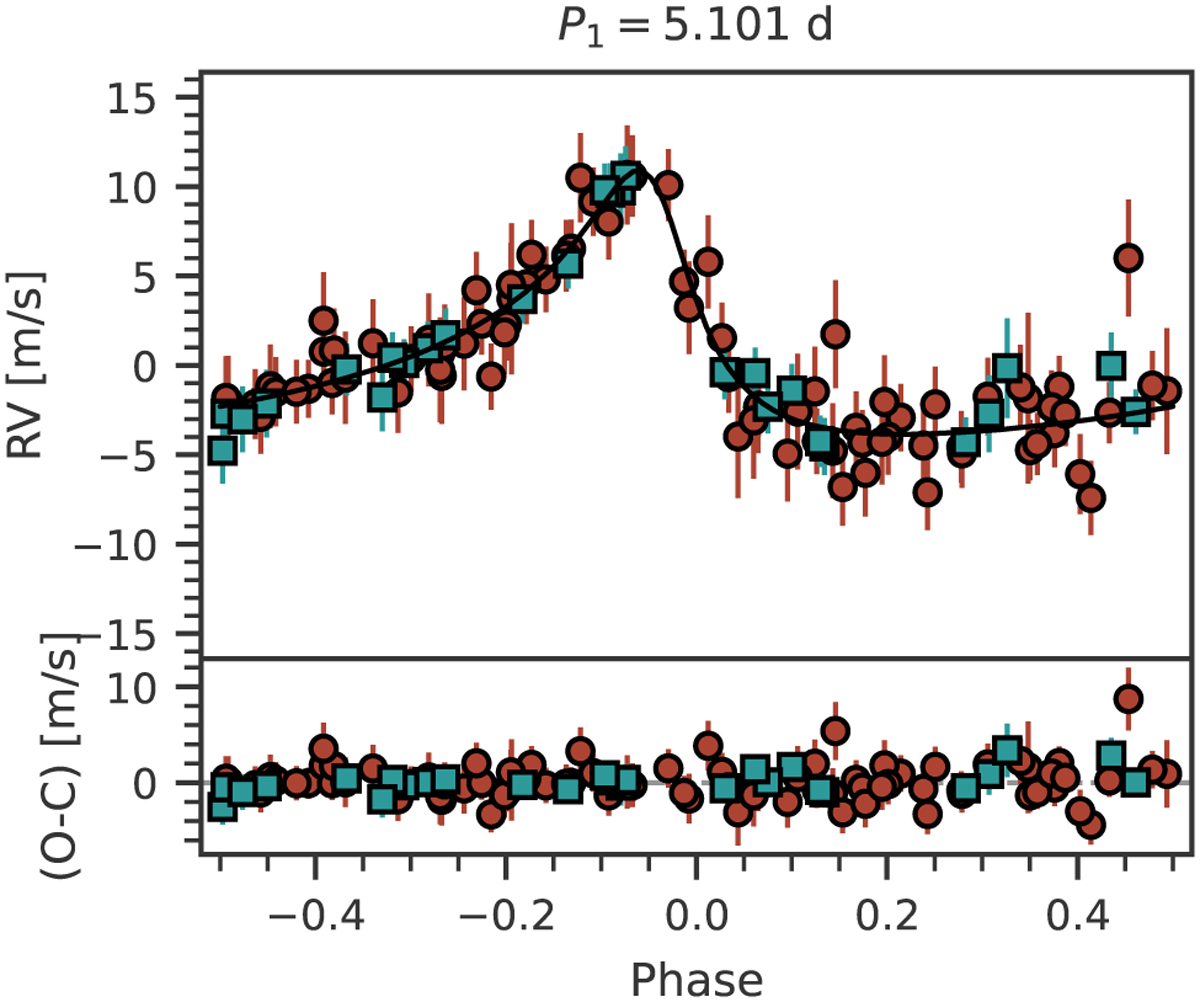
Fig. 6
Download original image
Phased RVs for GJ 724b from the best fit model (1P(5d-ecc) + dSHO-GP28 d). The red dots show the CARMENES data while the teal squares depicts the HARPS data. The black lines show the median of 10 000 samples from the posterior. The residuals after subtracting the median model are shown in the lower panel.
Current usage metrics show cumulative count of Article Views (full-text article views including HTML views, PDF and ePub downloads, according to the available data) and Abstracts Views on Vision4Press platform.
Data correspond to usage on the plateform after 2015. The current usage metrics is available 48-96 hours after online publication and is updated daily on week days.
Initial download of the metrics may take a while.