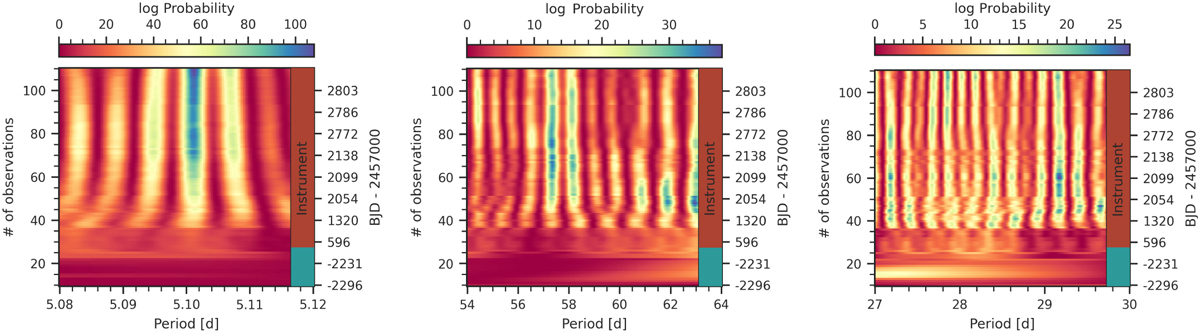
Fig. 5
Download original image
s–BGLS periodogram of the RV timeseries of GJ 724. The number of data points is plotted against the period. The top colour bar indicates the logarithm of the probability, whereas the side instrument bar shows from which instrument the data originate. CARMENES is shown in orange-red and HARPS in bluish-green. The left panel is centred on the 5.1 d signal, middle panel around 56 d, and right panel around 28 d.
Current usage metrics show cumulative count of Article Views (full-text article views including HTML views, PDF and ePub downloads, according to the available data) and Abstracts Views on Vision4Press platform.
Data correspond to usage on the plateform after 2015. The current usage metrics is available 48-96 hours after online publication and is updated daily on week days.
Initial download of the metrics may take a while.