Fig. 13
Download original image
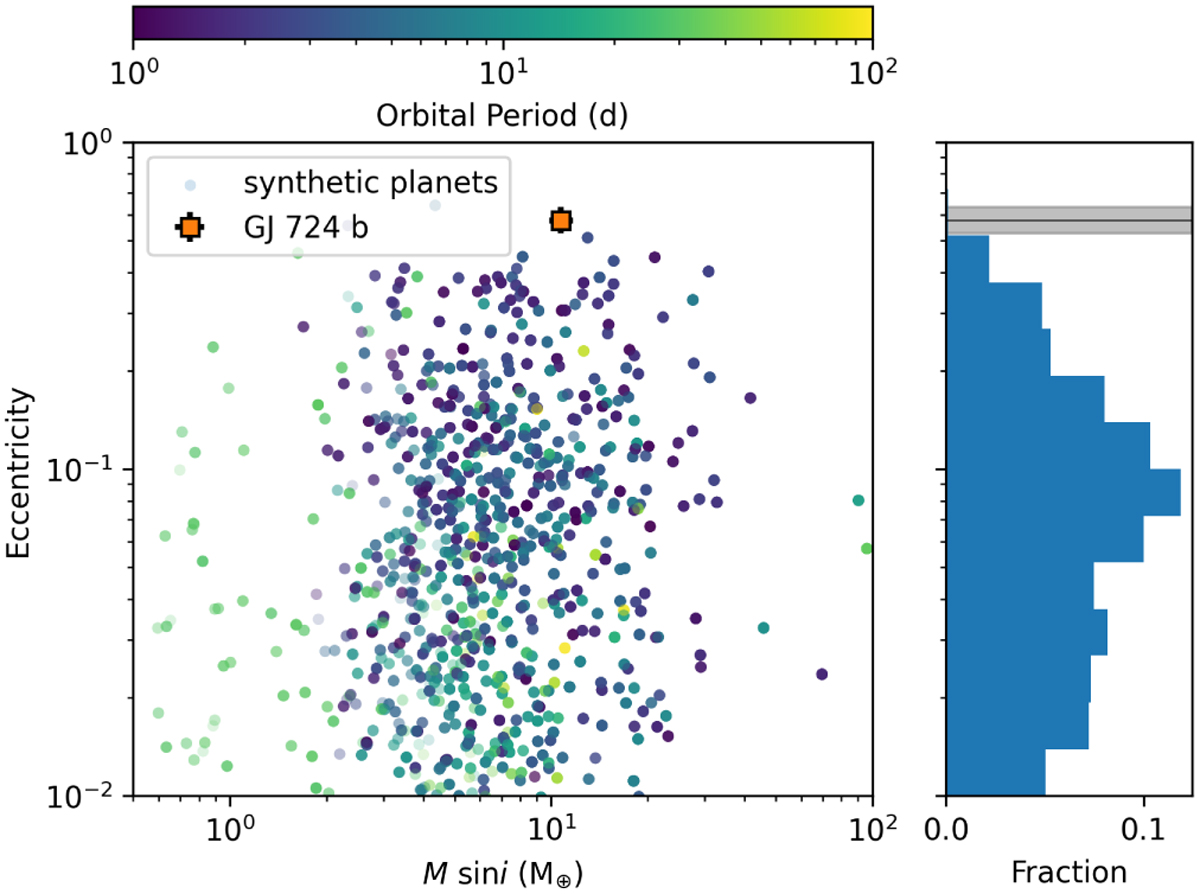
Synthetic planetary population as a function of M sin i and eccentricity. The colour shows the orbital period of the planets and the histogram depicts the fraction of theoretically expected observed planets, which is normalised by the number of planets in the same sam ple. The grey region corresponds to the eccentricity of GJ 724 b within 1σ range.
Current usage metrics show cumulative count of Article Views (full-text article views including HTML views, PDF and ePub downloads, according to the available data) and Abstracts Views on Vision4Press platform.
Data correspond to usage on the plateform after 2015. The current usage metrics is available 48-96 hours after online publication and is updated daily on week days.
Initial download of the metrics may take a while.