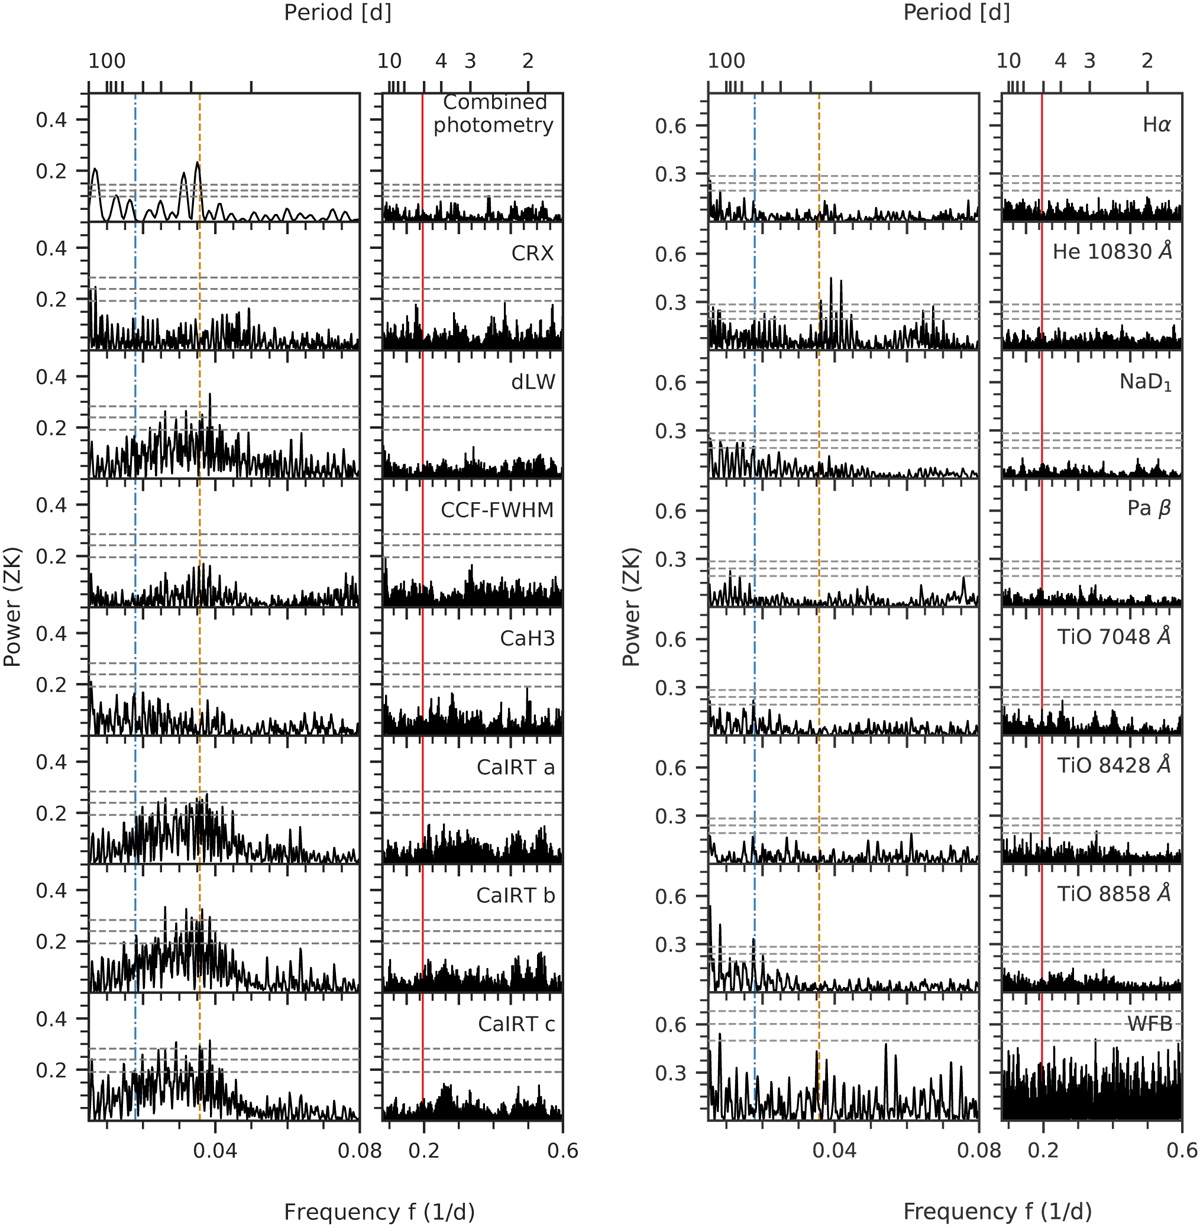
Fig. 1
Download original image
GLS periodograms of the (combined) photometric data and spectroscopic activity indicators from GJ 724 with peaks that reach at least a FAP level of 10% in the period range of 2 d to 200 d. The gray dashed horizontal lines correspond to the FAP levels of 0.1%, 1%, and 10% (from top to bottom, respectively). The mean rotation period of 56 d determined from the photometry is marked by the blue dashed line, while its second harmonic (Prot / 2) of 28 d is depicted by the orange dashed line. The period of the 5.1-day planet is highlighted by the red solid line.
Current usage metrics show cumulative count of Article Views (full-text article views including HTML views, PDF and ePub downloads, according to the available data) and Abstracts Views on Vision4Press platform.
Data correspond to usage on the plateform after 2015. The current usage metrics is available 48-96 hours after online publication and is updated daily on week days.
Initial download of the metrics may take a while.