Fig. 8.
Download original image
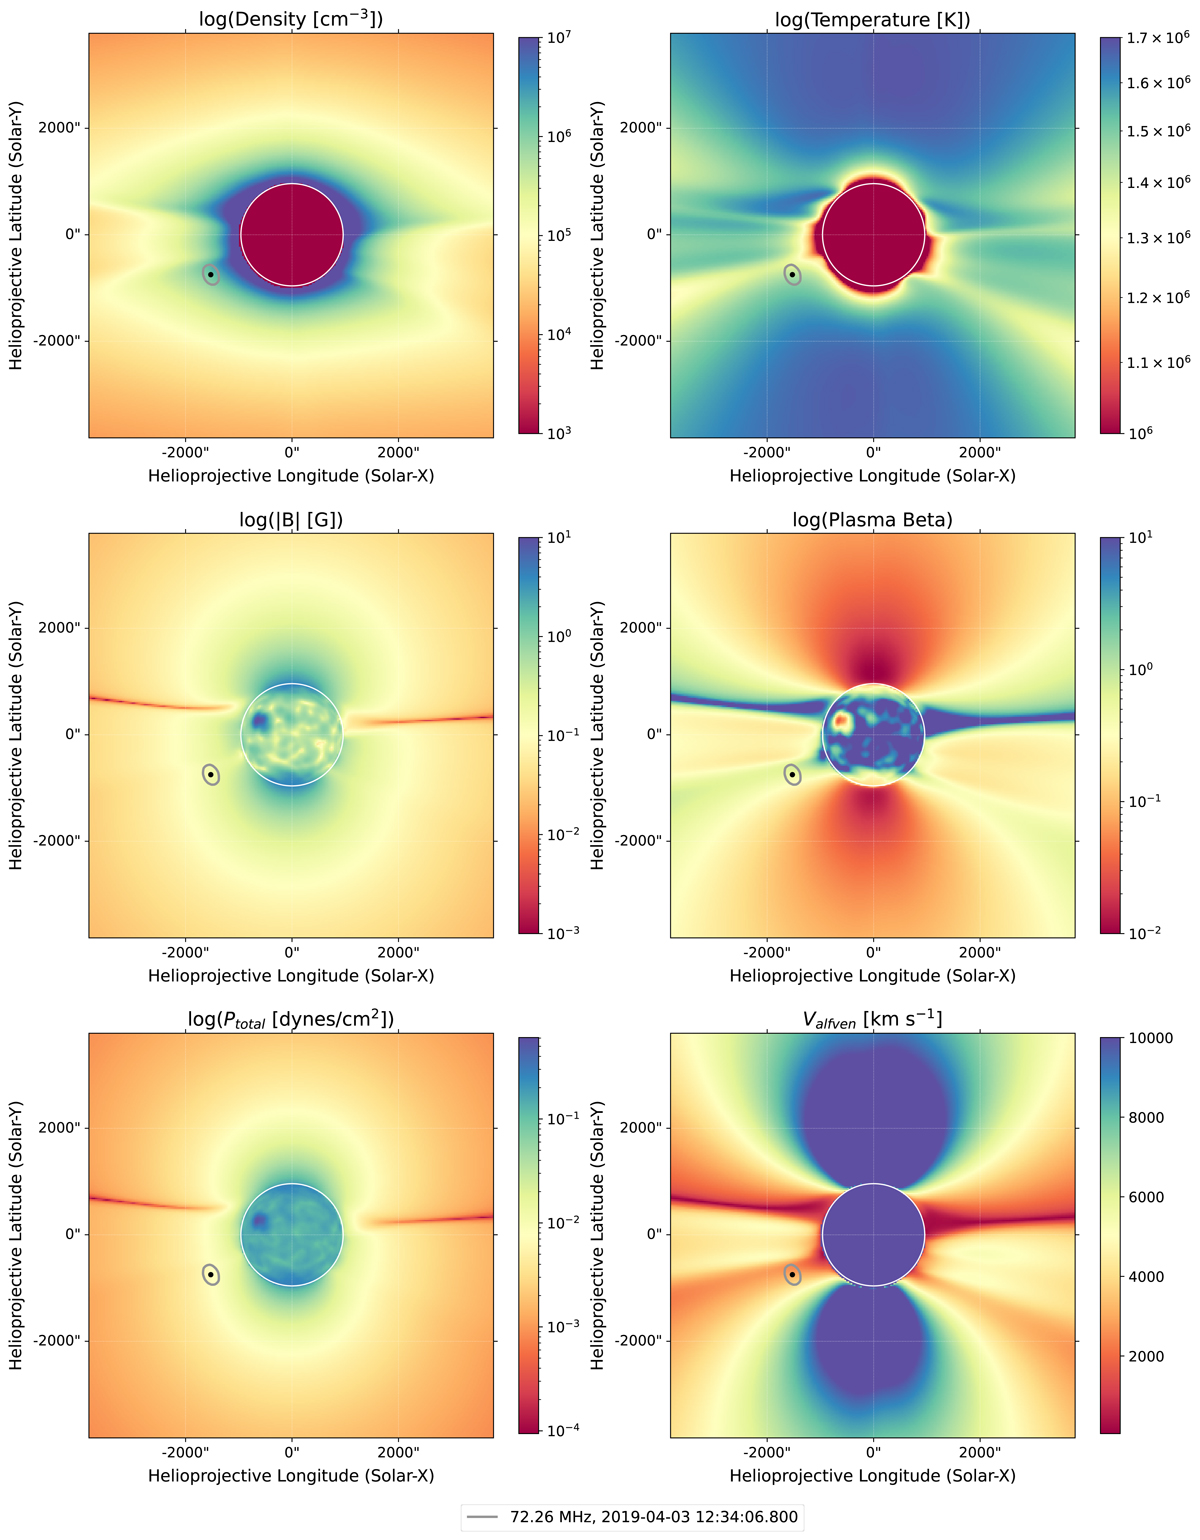
Synthesized maps of plasma parameters obtained using the FORWARD toolset, with the 70%-contour of radio emission of the sixth burst at the first timestamp (12:34:06.8 UT) at the frequency of 72.26 MHz depicted on top of the 2D POS cuts. The left column represents, from top to bottom, plasma density, magnetic field, and the total plasma dynamic pressure. The right column represents, from top to bottom, the temperature, plasma beta, and the Alfven speed.
Current usage metrics show cumulative count of Article Views (full-text article views including HTML views, PDF and ePub downloads, according to the available data) and Abstracts Views on Vision4Press platform.
Data correspond to usage on the plateform after 2015. The current usage metrics is available 48-96 hours after online publication and is updated daily on week days.
Initial download of the metrics may take a while.