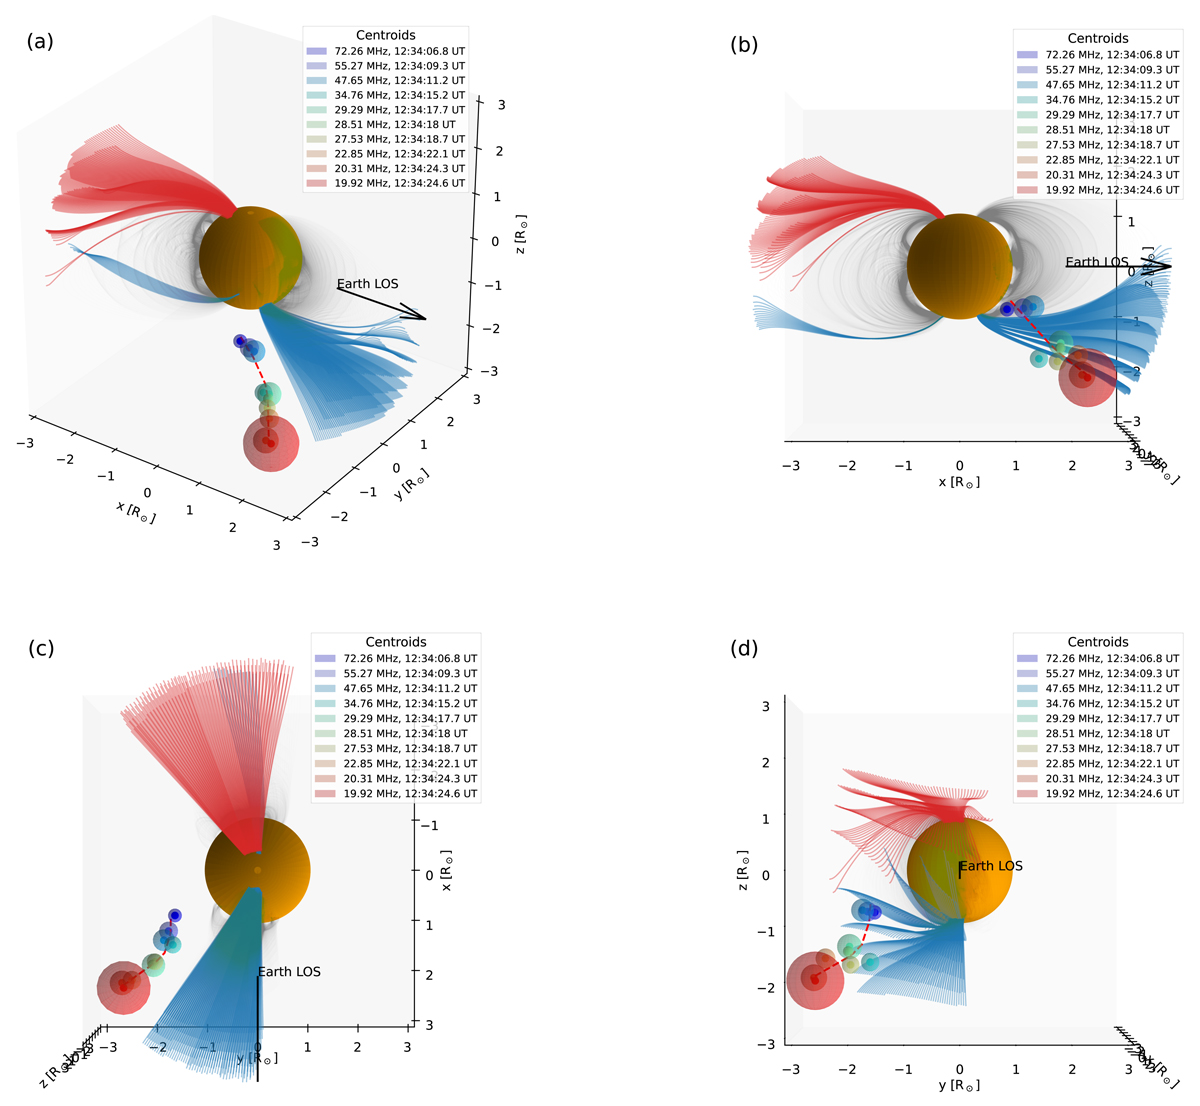
Fig. 7.
Download original image
Different viewing angles for the de-projection of the radio sources of the sixth burst using the 2.5 × Newkirk electron-density model on the PFSS solution. The black arrow points toward the Earth’s LOS. The yz plane is the POS as seen from the Earth. The red dashed line is a spline curve fit for the sources’ centroids. The red, black, and blue curves are the open northern, closed, and open southern field lines, respectively. The opacity of the closed field lines is decreased for a better visualization.
Current usage metrics show cumulative count of Article Views (full-text article views including HTML views, PDF and ePub downloads, according to the available data) and Abstracts Views on Vision4Press platform.
Data correspond to usage on the plateform after 2015. The current usage metrics is available 48-96 hours after online publication and is updated daily on week days.
Initial download of the metrics may take a while.