Open Access
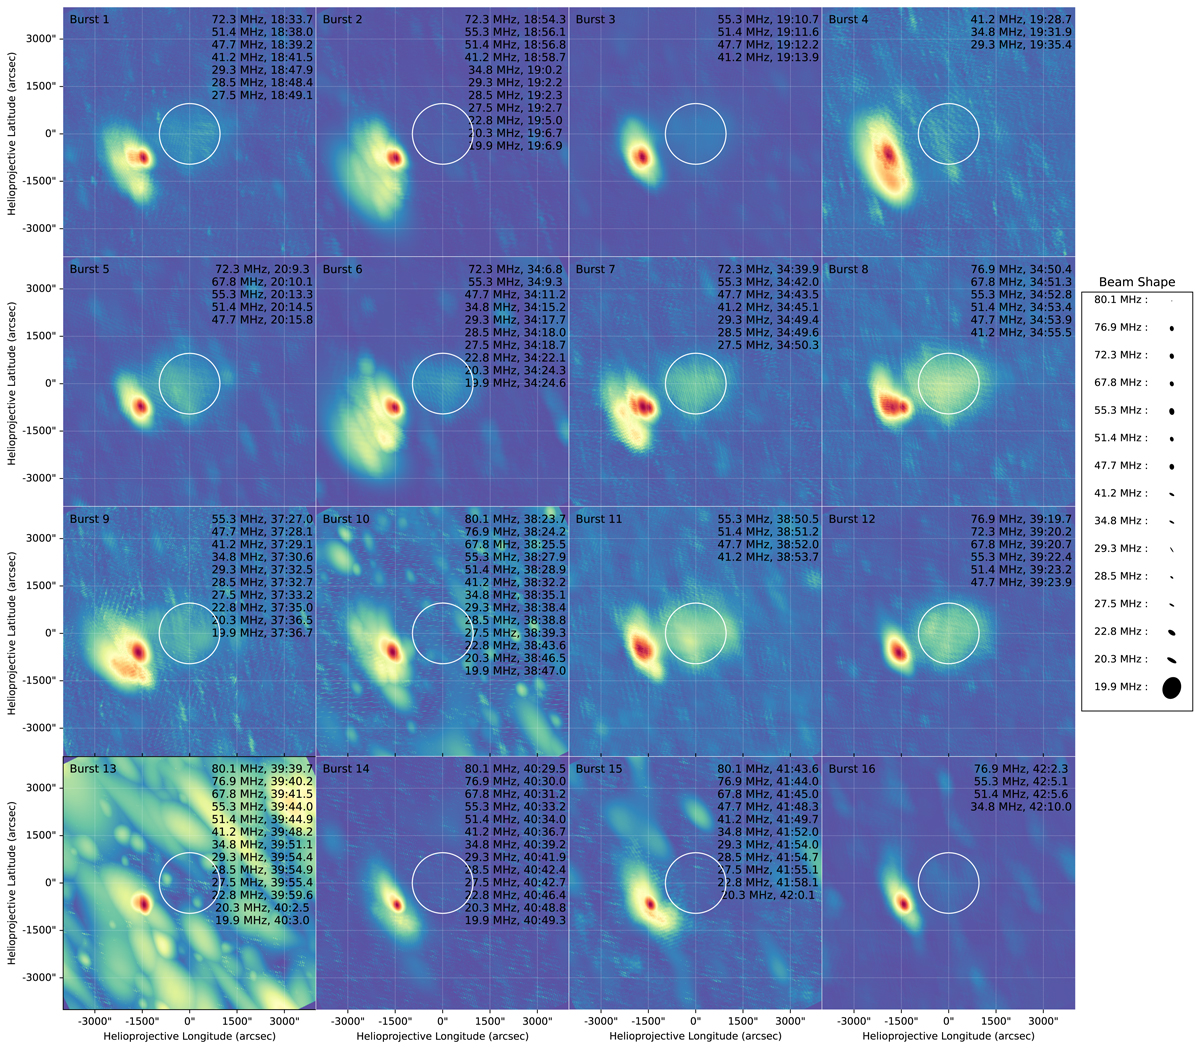
Fig. 6.
Download original image
Persistence imaging for the 16 type III bursts detected in the LOFAR dynamic spectrum. The label shows the observation frequencies in MHz and times in (minutes:seconds from 12:00:00 UT). Here, the color coding is not absolute, but rather each panel has its own color code.
Current usage metrics show cumulative count of Article Views (full-text article views including HTML views, PDF and ePub downloads, according to the available data) and Abstracts Views on Vision4Press platform.
Data correspond to usage on the plateform after 2015. The current usage metrics is available 48-96 hours after online publication and is updated daily on week days.
Initial download of the metrics may take a while.