Fig. 3.
Download original image
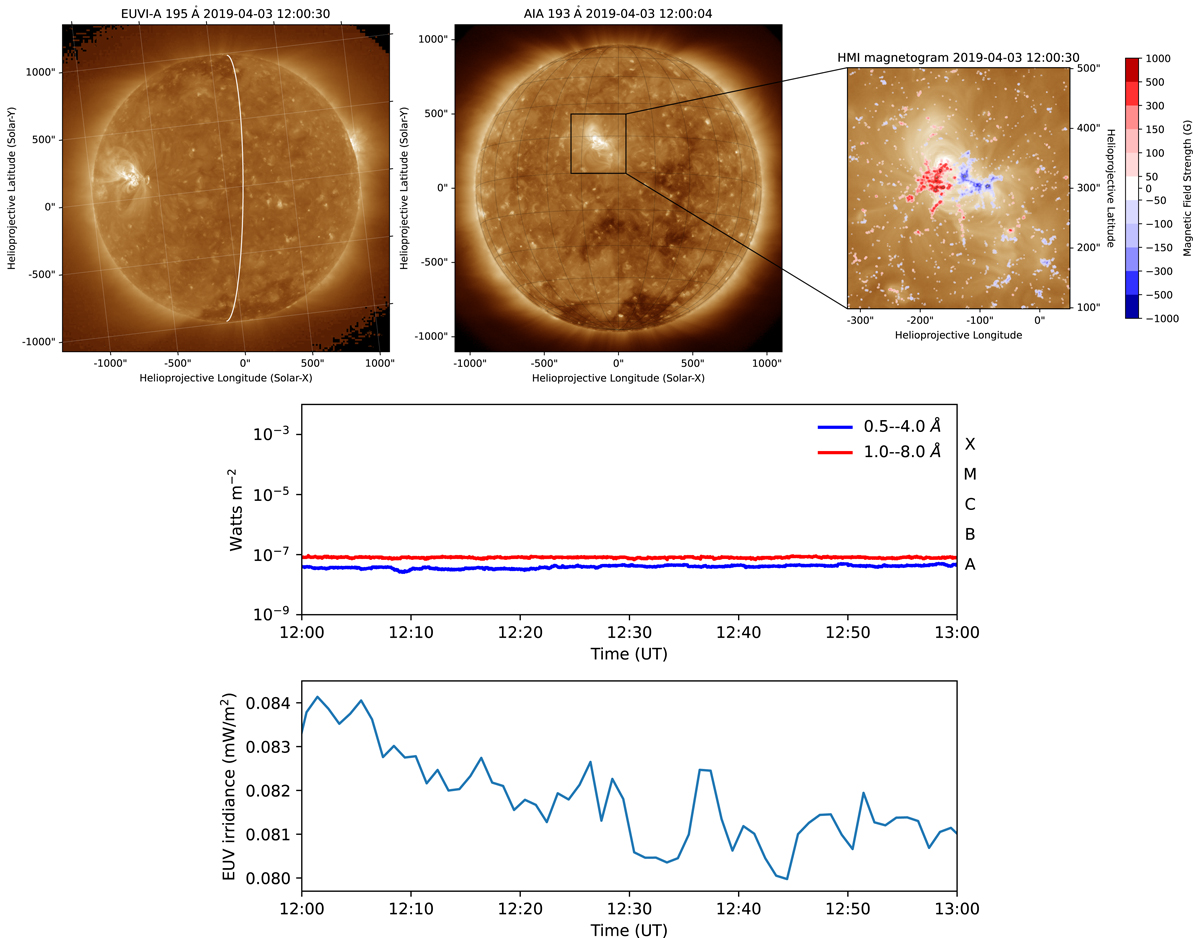
Exploring the X-ray and extreme ultraviolet (EUV) emissions from the Sun. The top panel showcases a cutout region of the SDO/AIA 193 Å image of the solar disk along with the STEREO-A EUVI 195 Å point of view. The white curve is the limb of the solar disk as seen by AIA from the right side. The red and blue colors are the contours of the line-of-sight magnetogram from the SDO/HMI instrument. The levels are (50, 100, 150, 300, 500, 1000) Gauss. The middle panel shows the X-ray flux from the GOES-14 spacecraft shows minimum activity. The bottom panel shows the time series of the ESP Quad band from the SDO/EVE instrument, which shows the solar irradiance in the extreme ultraviolet (EUV) band.
Current usage metrics show cumulative count of Article Views (full-text article views including HTML views, PDF and ePub downloads, according to the available data) and Abstracts Views on Vision4Press platform.
Data correspond to usage on the plateform after 2015. The current usage metrics is available 48-96 hours after online publication and is updated daily on week days.
Initial download of the metrics may take a while.