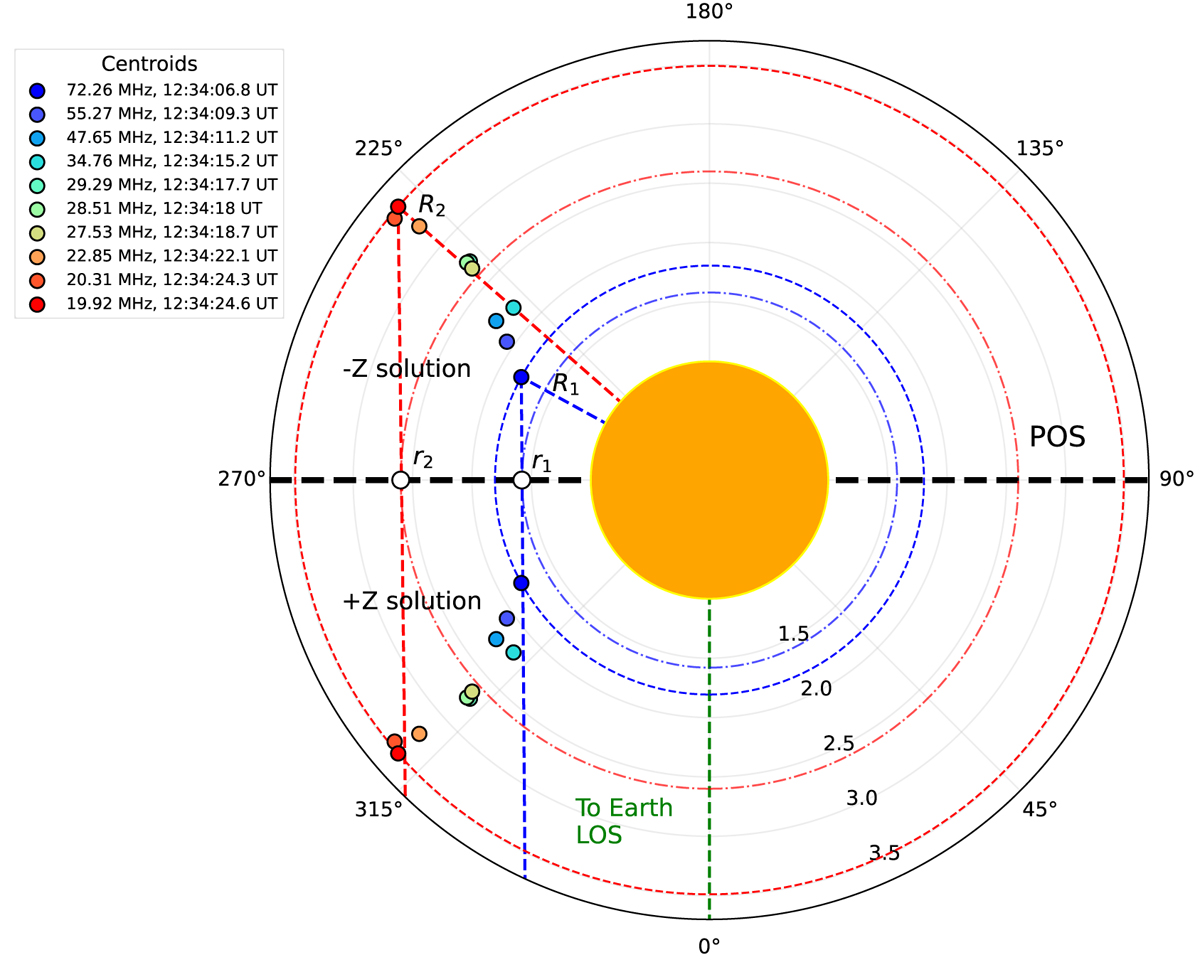
Fig. B.1.
Download original image
Schematic shows the locations of the radio sources for the +Z and -Z solutions of Equation 4. The Sun is located in the middle as an orange circle, with a horizontal dashed black line representing the POS. The vertical dashed green line represents the Sun-Earth LOS. The dashed blue and red circles represent the plasma spheres of density equivalent to the observation frequencies of the innermost and outermost radio sources at R1 and R2, respectively, under the Newkirk model assumption of spherically-symmetric density distribution. The impact parameters r1 and r2 are the projection of R1 and R2 on the POS. The dot-dashed blue and red circles are the circles passing through the impact parameters r1 and r2, respectively.
Current usage metrics show cumulative count of Article Views (full-text article views including HTML views, PDF and ePub downloads, according to the available data) and Abstracts Views on Vision4Press platform.
Data correspond to usage on the plateform after 2015. The current usage metrics is available 48-96 hours after online publication and is updated daily on week days.
Initial download of the metrics may take a while.