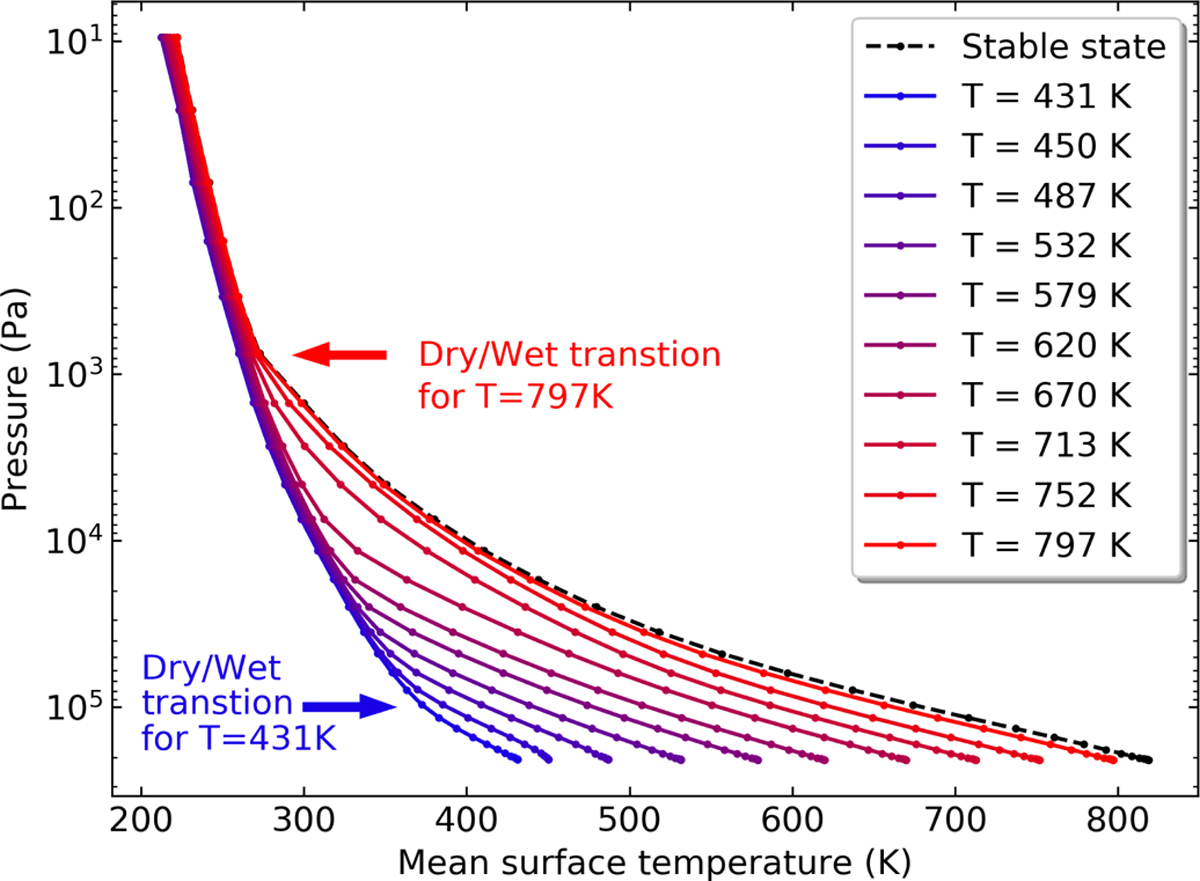
Fig. 7
Download original image
Temperature profile for different surface temperature during the dry transition with 1 bar of water vapor. Arrows indicate the transition between a dry adiabat in the lower part of the atmosphere (high pressures) and a wet one in the bottom part (low pressures) for the coldest (blue) and hottest (red) cases. Dry region is below the transition while moist one is above (Abe & Matsui 1988; Kasting 1988). The simulation setup is the waterworld with 1 bar of nitrogen without CO2 (W1).
Current usage metrics show cumulative count of Article Views (full-text article views including HTML views, PDF and ePub downloads, according to the available data) and Abstracts Views on Vision4Press platform.
Data correspond to usage on the plateform after 2015. The current usage metrics is available 48-96 hours after online publication and is updated daily on week days.
Initial download of the metrics may take a while.