Fig. 6
Download original image
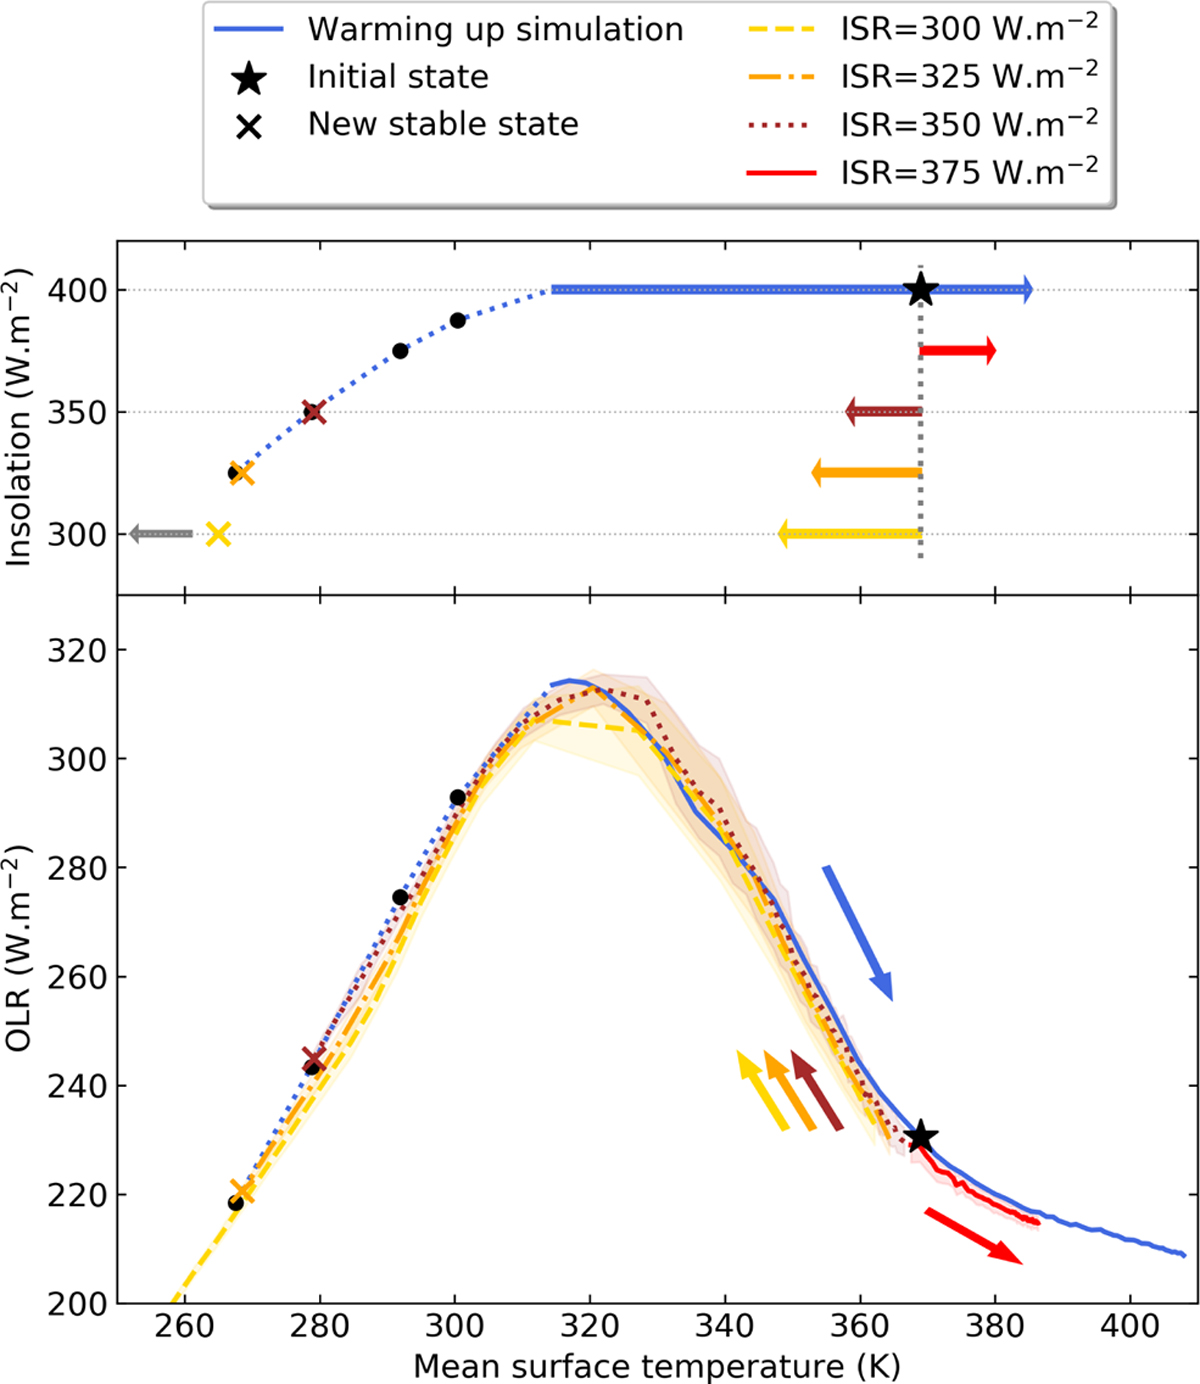
Evolution of the thermal emission when water vapor condense back into the surface ocean. The bottom panel is the OLR function of the mean surface temperature. The top panel is the insolation of each simulation. The blue curve is the warming simulation presented in Fig. 1 with an insolation equal to 400 W m−2. Black dots are stable states assuming a two-year average. Other colored curves (yellow, orange, brown, and red) are the evolution of the OLR for lower insolations and assuming a initial temperature equal to 369 K (the black star). Arrows represent the tendency of the evolution of the global surface temperature (warming or cooling) for different insolations. Colored crosses represent the stable stable found for cooling simulations (ISR=300 W m−2, 325 W m−2, and 350 W m−2, respectively). The top panel highlight the hysteresis loop induced by the clouds feedback during the runaway greenhouse. However, the bottom panel shows that there is no dependence of the OLR on the insolation for a given surface temperature. The simulation setup is a waterworld with 1 bar of nitrogen without CO2 (WCO2).
Current usage metrics show cumulative count of Article Views (full-text article views including HTML views, PDF and ePub downloads, according to the available data) and Abstracts Views on Vision4Press platform.
Data correspond to usage on the plateform after 2015. The current usage metrics is available 48-96 hours after online publication and is updated daily on week days.
Initial download of the metrics may take a while.