Fig. 5
Download original image
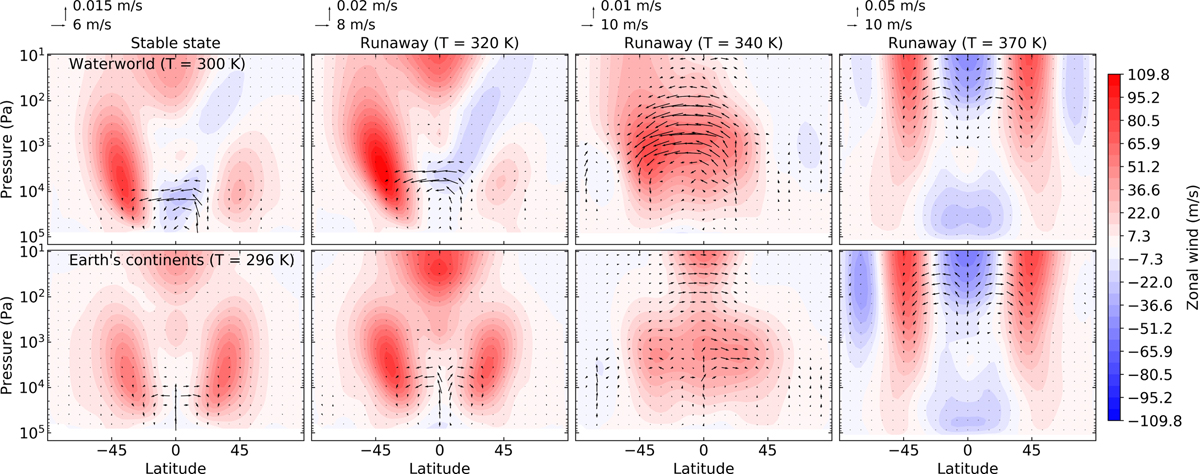
Evolution of the wind circulation during the runaway greenhouse. The color map represent the zonal wind (positive values represent eastward winds) and the arrows the vertical and meridional winds averaged over 1 year. The first row is the evolution of the winds for the waterworld setup (W1) and the bottom row is considering the Earth’s continents (E1), both without CO2. The first panel of each row is the warmer stable state obtained for the two considered setups at I = 375 W m2. Others show the evolution during the runaway greenhouse for different temperatures. Wind speeds corresponding to the length of the arrows vary with temperature.
Current usage metrics show cumulative count of Article Views (full-text article views including HTML views, PDF and ePub downloads, according to the available data) and Abstracts Views on Vision4Press platform.
Data correspond to usage on the plateform after 2015. The current usage metrics is available 48-96 hours after online publication and is updated daily on week days.
Initial download of the metrics may take a while.