Fig. 2
Download original image
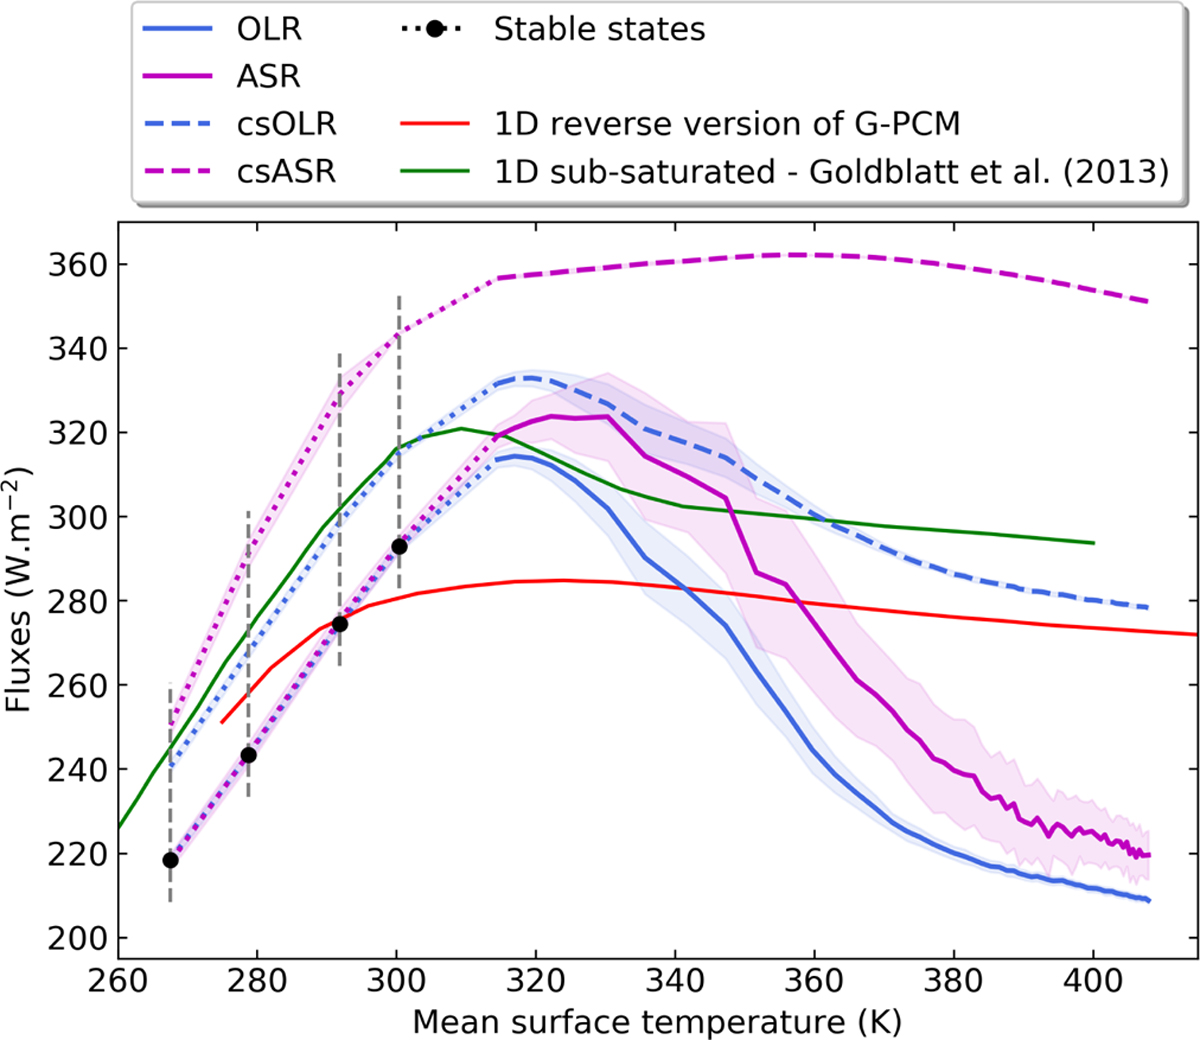
Thermal emission and absorbed flux as a function of the mean surface temperature. Blue and purple solid lines are OLR and ASR, respectively, while the blue and purple dashed lines are their clear-sky equivalent (csOLR and csASR). Black dots are the stable states and the blue solid line is the runaway greenhouse for an insolation equal to 400 W m−2. The simulation setup is a waterworld with 1 bar of nitrogen without CO2 (W1). For comparison, the red line is the OLR computed with the 1D reverse version of the Generic-PCM which uses the same radiative transfer module and assume a fully saturated atmosphere (named the 1D reverse version of LMD-Generic in Chaverot et al. 2022). The green line is the OLR computed using a 1D reverse model assuming a subsaturated atmosphere (saturation mixing ratio less than 5%) from Goldblatt et al. (2013). The flux and temperature values are averaged over a two-year period and the colored areas are the 1 sigma uncertainties due to variability on the fluxes calculation.
Current usage metrics show cumulative count of Article Views (full-text article views including HTML views, PDF and ePub downloads, according to the available data) and Abstracts Views on Vision4Press platform.
Data correspond to usage on the plateform after 2015. The current usage metrics is available 48-96 hours after online publication and is updated daily on week days.
Initial download of the metrics may take a while.