Fig. A.3
Download original image
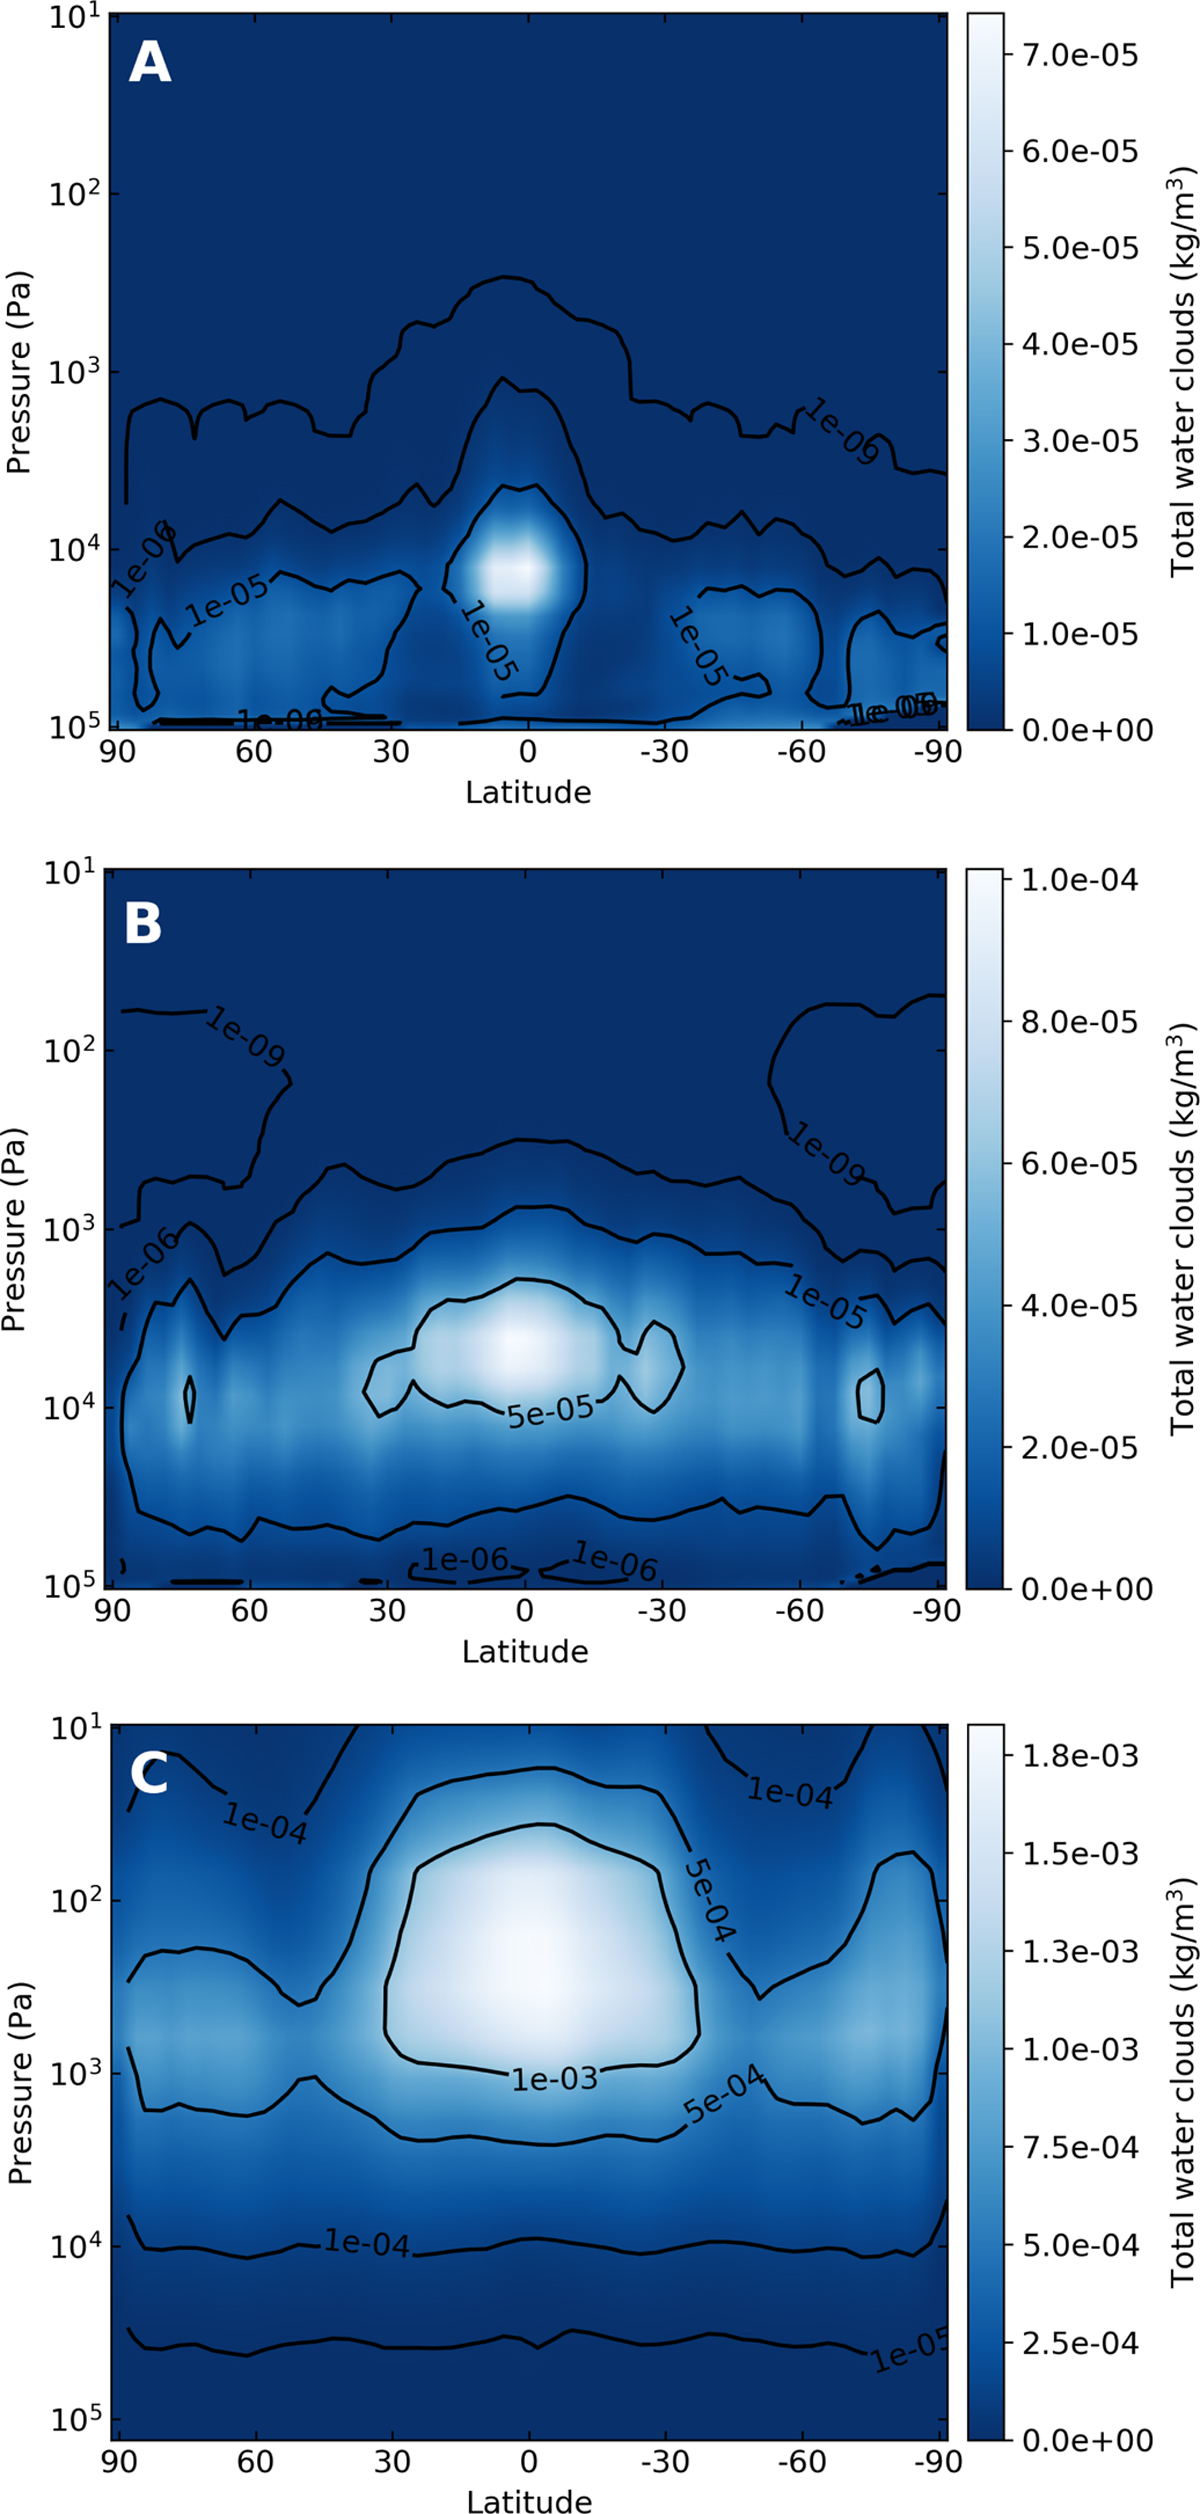
Evolution of the latitude-altitude map of the water cloud (liquid + ice) distribution during the evaporation phase. The simulation setup is the Earth with 1 bar of nitrogen without CO2 (E1). The maps are averaged over two years. The A, B and C panels correspond to global surface temperatures of 320 K, 340 K, and 370 K, respectively.
Current usage metrics show cumulative count of Article Views (full-text article views including HTML views, PDF and ePub downloads, according to the available data) and Abstracts Views on Vision4Press platform.
Data correspond to usage on the plateform after 2015. The current usage metrics is available 48-96 hours after online publication and is updated daily on week days.
Initial download of the metrics may take a while.