Fig. A.1
Download original image
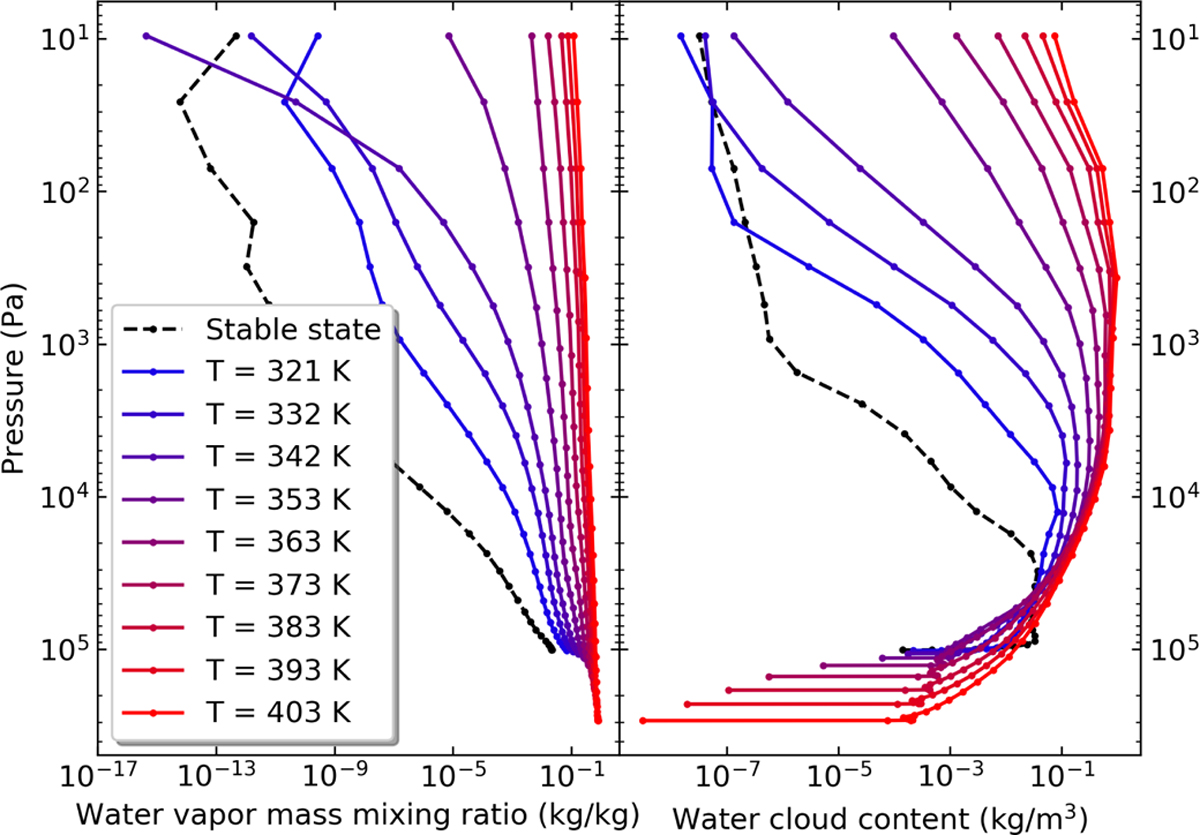
Evolution of the water vapor mass mixing ratio and of the mean vertical profile of the water cloud (liquid + ice) content during the evaporation phase. The simulation setup is the waterworld with 1 bar of nitrogen without CO2 (W1). The profiles are averaged over one year. The dashed black line corresponds to the temperate stable state with the highest insolation (ISR=375 W m−2).
Current usage metrics show cumulative count of Article Views (full-text article views including HTML views, PDF and ePub downloads, according to the available data) and Abstracts Views on Vision4Press platform.
Data correspond to usage on the plateform after 2015. The current usage metrics is available 48-96 hours after online publication and is updated daily on week days.
Initial download of the metrics may take a while.