Fig. 13
Download original image
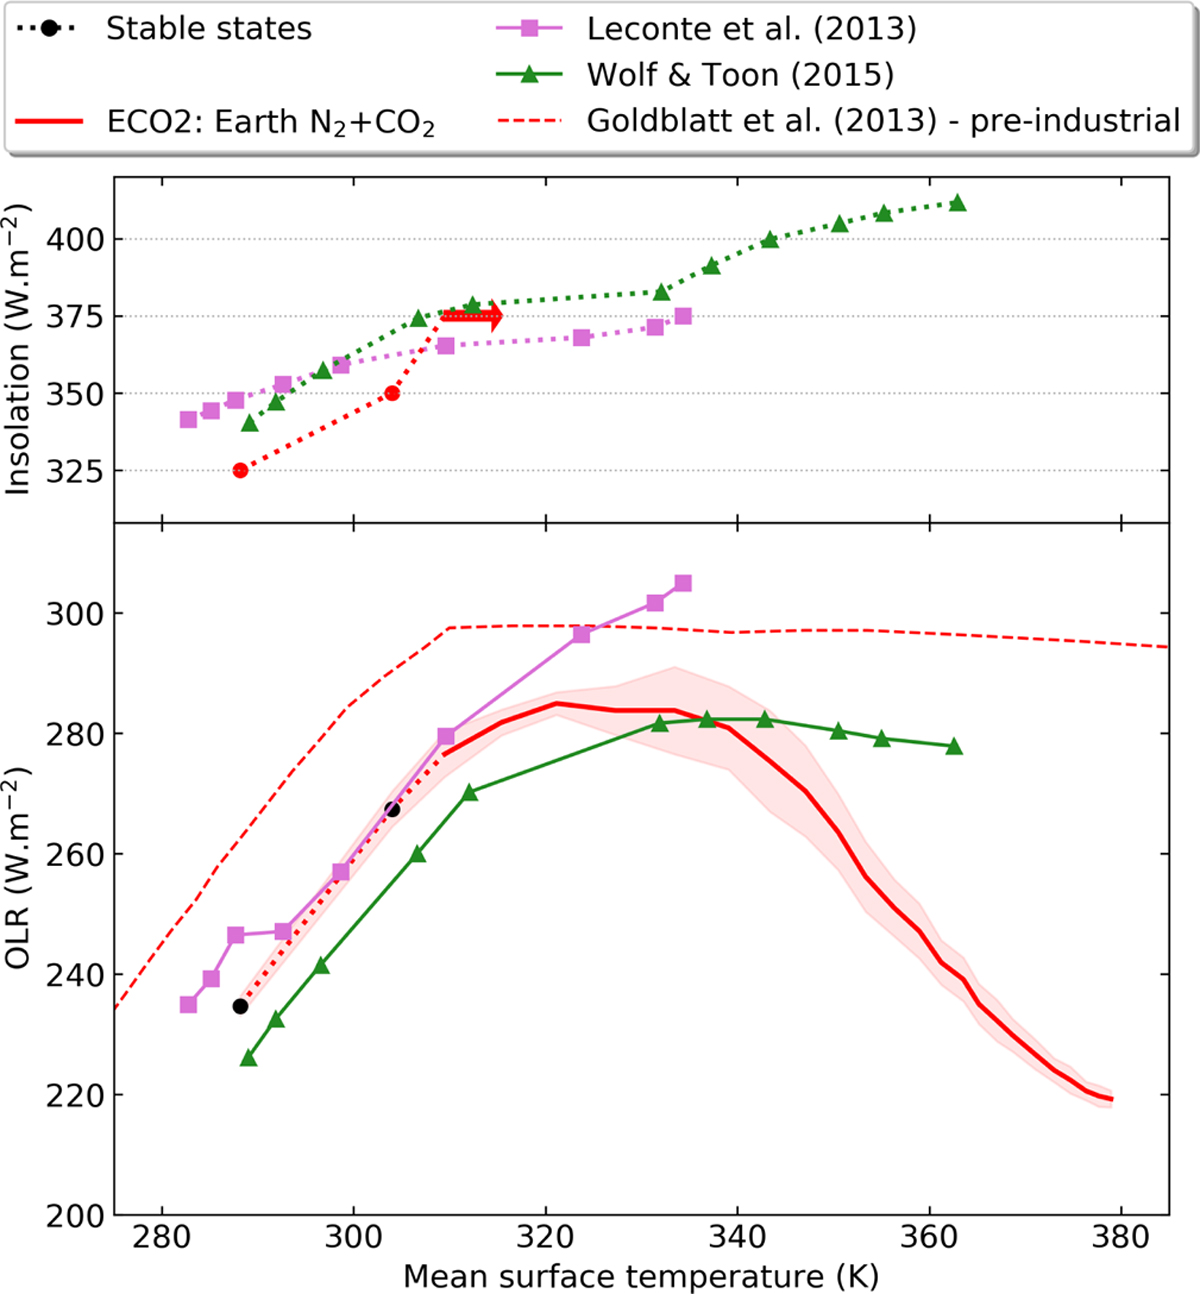
Literature comparison of the OLR and the insolation as a function of the temperature. The black dots are the stables states corresponding to various insolations, while the full curves are the unstable state of the runaway greenhouse. The top panel indicates the insolation values of each stable state. The colored arrows represent the insolation for which the runaway greenhouse arises for each setup. The OLR and temperature values are averaged over two years and the colored fills are the 1 sigma uncertainties due to variability on the OLR calculation. Pink squares and green triangles are steady states of the Earth’s case from Leconte et al. (2013) and Wolf & Toon (2015), respectively. The red dashed curve is a reference result from Goldblatt et al. (2013) for a pre-industrial atmosphere and using a 1D model, assuming saturation mixing ratio below 5%.
Current usage metrics show cumulative count of Article Views (full-text article views including HTML views, PDF and ePub downloads, according to the available data) and Abstracts Views on Vision4Press platform.
Data correspond to usage on the plateform after 2015. The current usage metrics is available 48-96 hours after online publication and is updated daily on week days.
Initial download of the metrics may take a while.