Fig. 12
Download original image
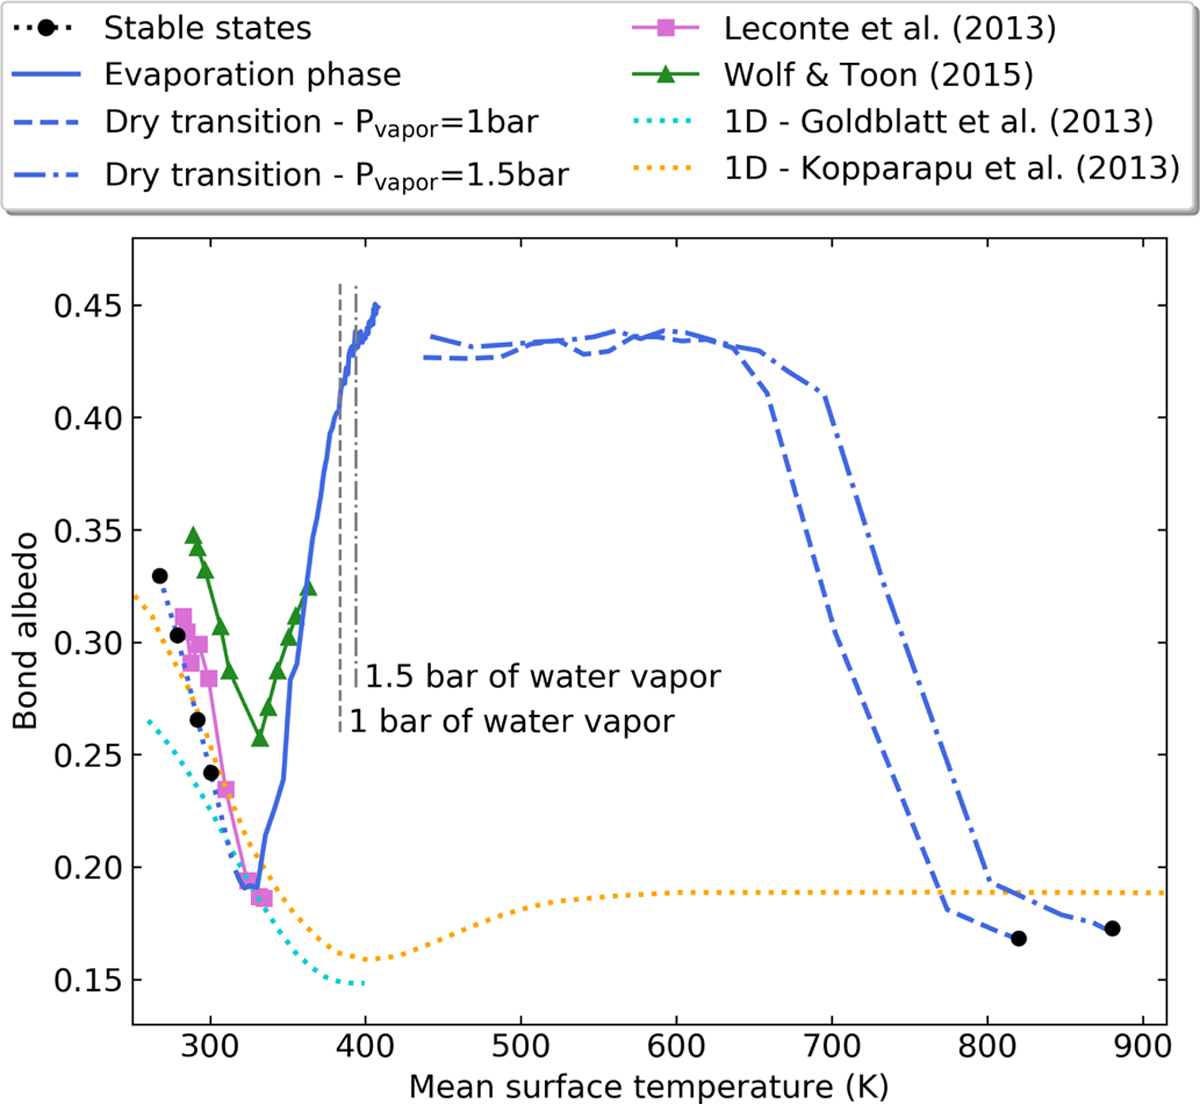
Evolution of the bond albedo as a function of the mean surface temperature from temperate stable states to post-runaway stable states. The simulation setup is the waterworld with 1 bar of nitrogen without CO2 (W1). The insolation of the evaporation phase and the dry transition is equal to 400 W m−2. The vertical grey lines are the temperatures for which 1 bar and 1.5 bar of water vapor are evaporated. The albedo values are averaged over 2 years which explain the gap between the evaporation and the dry transition phases. Pink squares and green triangles are steady states of the Earth’s case from Leconte et al. (2013) and Wolf & Toon (2015) respectively. Dotted lines are albedo curves from reference works using 1D models (1 bar of N2 from Goldblatt et al. 2013 and Earth’s case from Kopparapu et al. 2013).
Current usage metrics show cumulative count of Article Views (full-text article views including HTML views, PDF and ePub downloads, according to the available data) and Abstracts Views on Vision4Press platform.
Data correspond to usage on the plateform after 2015. The current usage metrics is available 48-96 hours after online publication and is updated daily on week days.
Initial download of the metrics may take a while.