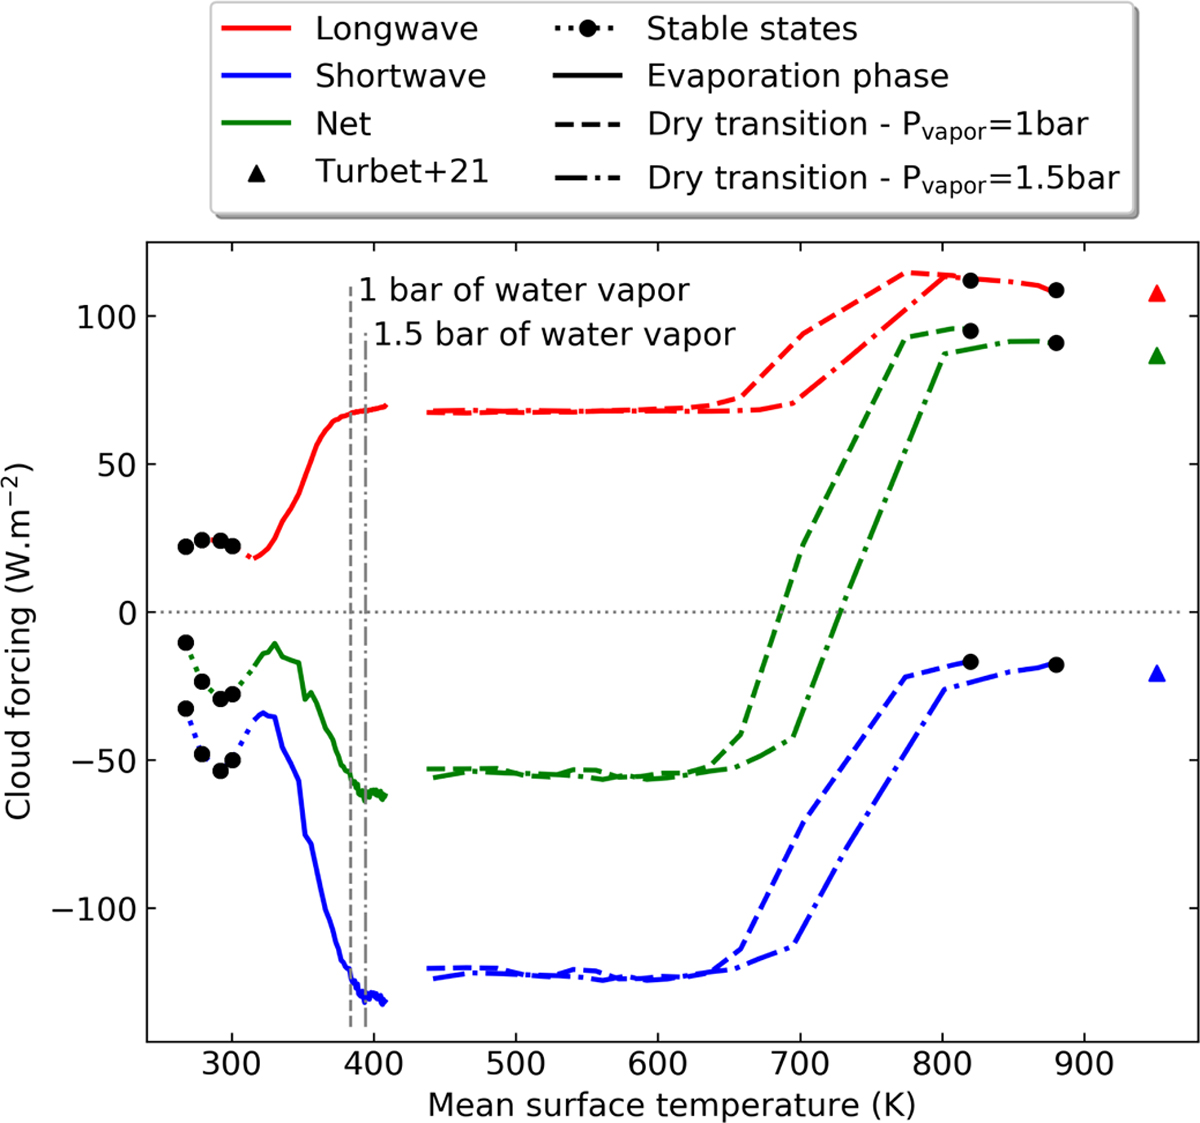
Fig. 11
Download original image
Evolution of the cloud forcing during the runaway greenhouse. Solid lines are the evaporation and dry transition phases while black dots are stable states assuming a two-year average. Negatives values indicate a cooling effect of the clouds and positive ones a warming effect. In the longwave (blue curves), clouds have a cooling effect due to their high albedo reflecting the incoming stellar flux back to space. The red curve correspond to the warming contribution due to the greenhouse effect of the clouds (i.e., thermal mission absorbed by the clouds). The green curve is the net effect of the clouds, including shortwave and longwave contributions. The vertical grey lines are the temperatures for which 1 bar and 1.5 bar of water vapor are evaporated. These are used as initial conditions for the dry transition phase (colored dotted lines). Colored triangles are the values obtained in Turbet et al. (2021) for the same insolation (400 W m−2), but including 10 bar of water vapor. The fluxes values are averaged over two years, which explain the gap between the evaporation and the dry transition phases. The simulation setup is the waterworld with 1 bar of nitrogen without CO2 (W1).
Current usage metrics show cumulative count of Article Views (full-text article views including HTML views, PDF and ePub downloads, according to the available data) and Abstracts Views on Vision4Press platform.
Data correspond to usage on the plateform after 2015. The current usage metrics is available 48-96 hours after online publication and is updated daily on week days.
Initial download of the metrics may take a while.