Fig. 10
Download original image
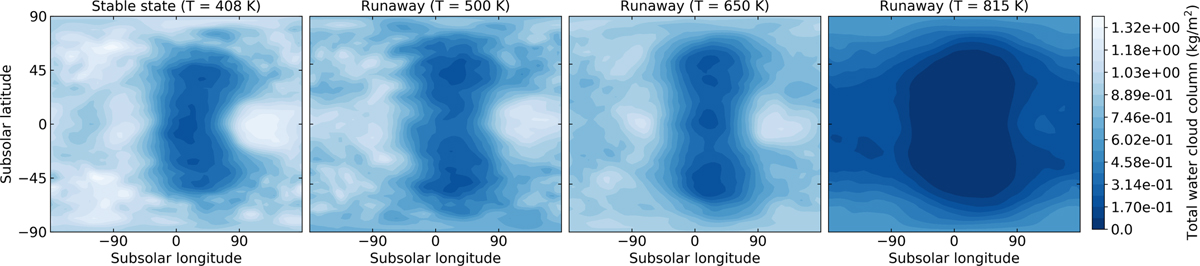
Latitude-longitude map of the cloud (liquid + ice) distribution during the dry transition phase with 1 bar of vapor. The maps were calculated in the heliocentric frame that is keeping the subsolar point at 0° longitude and 0° latitude, and using an annual average. The simulation setup is the waterworld assuming 1 bar of nitrogen without CO2 (W1).
Current usage metrics show cumulative count of Article Views (full-text article views including HTML views, PDF and ePub downloads, according to the available data) and Abstracts Views on Vision4Press platform.
Data correspond to usage on the plateform after 2015. The current usage metrics is available 48-96 hours after online publication and is updated daily on week days.
Initial download of the metrics may take a while.