Fig. 1
Download original image
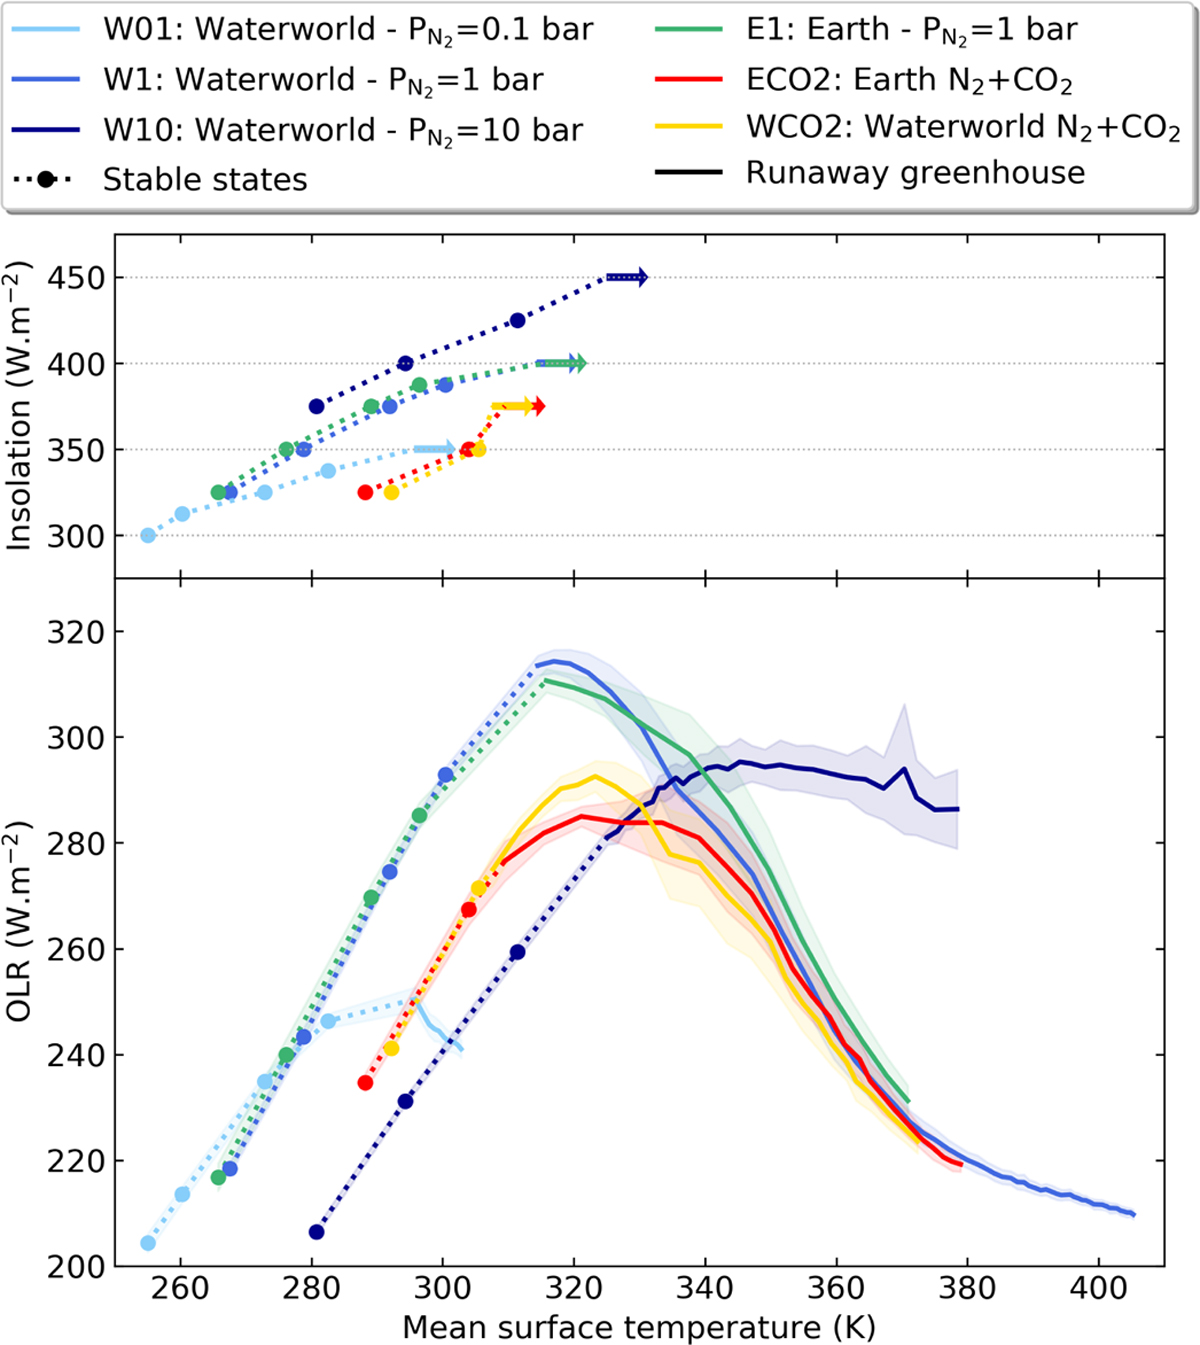
Evolution of the thermal emission during the onset of the runaway greenhouse. Bottom panel: values of the OLR function of the global surface temperature for each simulation setup described in Table 1. Colored dots are the stables states corresponding to various insolations, while the full curves are the instable state of the runaway greenhouse. Top panel: insolation values of each stable state. The colored arrows represent the insolation for which the runaway greenhouse arises for each setup. The OLR and temperature values are averaged over two years (for both the stable states and the runaway greenhouse) and the colored fills are the 1-sigma uncertainties due to variability on the OLR calculation.
Current usage metrics show cumulative count of Article Views (full-text article views including HTML views, PDF and ePub downloads, according to the available data) and Abstracts Views on Vision4Press platform.
Data correspond to usage on the plateform after 2015. The current usage metrics is available 48-96 hours after online publication and is updated daily on week days.
Initial download of the metrics may take a while.