Open Access
Fig. B.1
Download original image
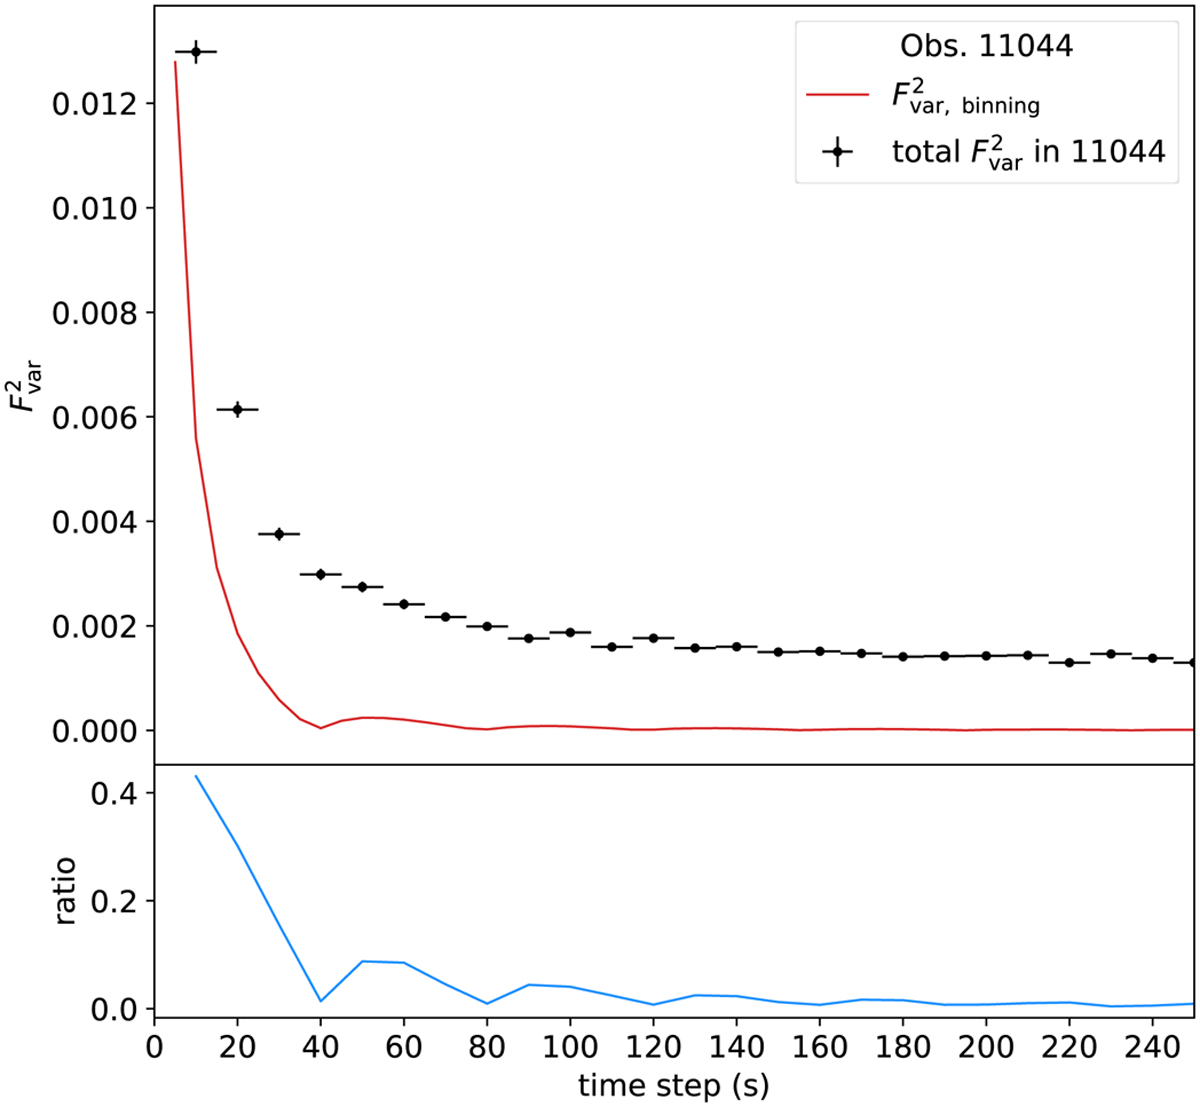
Systematic variability, ![]() , introduced by the timing resolution of the ACIS detector (red line) compared to total
, introduced by the timing resolution of the ACIS detector (red line) compared to total ![]() in the broad band (2–14 Å, black data points) and their ratio, shown in the bottom panel. As a time step of 500 s is used for Obs. 11044, the effect is negligible in our analysis.
in the broad band (2–14 Å, black data points) and their ratio, shown in the bottom panel. As a time step of 500 s is used for Obs. 11044, the effect is negligible in our analysis.
Current usage metrics show cumulative count of Article Views (full-text article views including HTML views, PDF and ePub downloads, according to the available data) and Abstracts Views on Vision4Press platform.
Data correspond to usage on the plateform after 2015. The current usage metrics is available 48-96 hours after online publication and is updated daily on week days.
Initial download of the metrics may take a while.