Fig. 4
Download original image
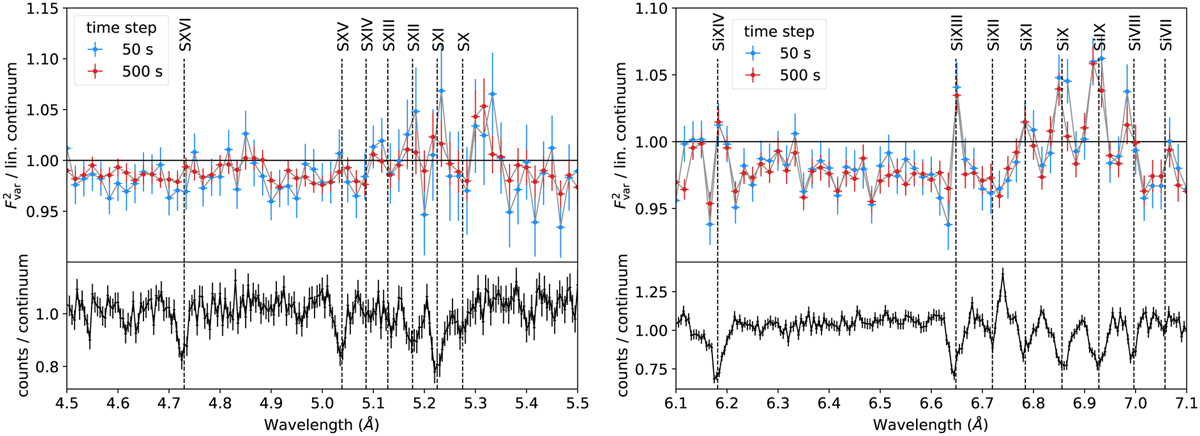
Sulphur (left) and silicon (right) line regions. The ![]() spectrum of Obs. 3814 is shown relative to the linear fit from Fig. 2 (black) and compared to the count spectrum (lower panels) from Hirsch et al. (2019) and the rest-wavelength of detected lines. The count spectrum is given relative to a local power-law fit in the wavelength bands indicated in the figure and is the sum of spectra of all dip stages. Two time binnings are displayed for the
spectrum of Obs. 3814 is shown relative to the linear fit from Fig. 2 (black) and compared to the count spectrum (lower panels) from Hirsch et al. (2019) and the rest-wavelength of detected lines. The count spectrum is given relative to a local power-law fit in the wavelength bands indicated in the figure and is the sum of spectra of all dip stages. Two time binnings are displayed for the ![]() spectrum, 50 s (blue) and 500 s (red), to investigate the effect of the added higher frequencies. Lines connect the data points for clarity. Overall, there is a good correspondence between
spectrum, 50 s (blue) and 500 s (red), to investigate the effect of the added higher frequencies. Lines connect the data points for clarity. Overall, there is a good correspondence between ![]() spike features and known line positions.
spike features and known line positions.
Current usage metrics show cumulative count of Article Views (full-text article views including HTML views, PDF and ePub downloads, according to the available data) and Abstracts Views on Vision4Press platform.
Data correspond to usage on the plateform after 2015. The current usage metrics is available 48-96 hours after online publication and is updated daily on week days.
Initial download of the metrics may take a while.